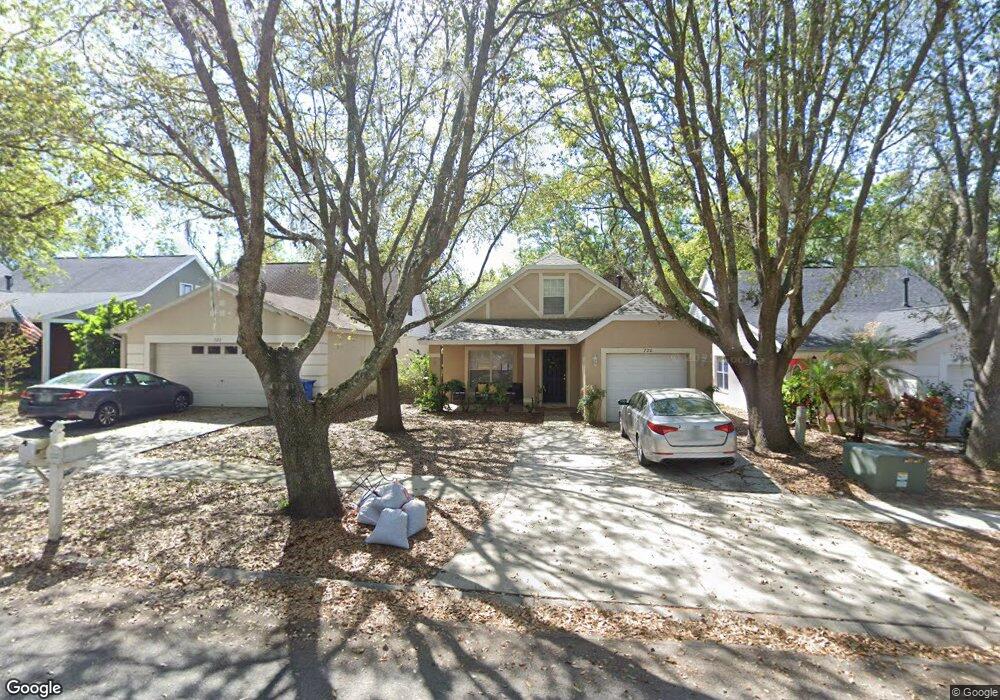
720 Cape Cod Cir Valrico, FL 33594
Estimated Value: $291,000 - $311,000
3
Beds
2
Baths
1,402
Sq Ft
$216/Sq Ft
Est. Value
About This Home
This home is located at 720 Cape Cod Cir, Valrico, FL 33594 and is currently estimated at $302,344, approximately $215 per square foot. 720 Cape Cod Cir is a home located in Hillsborough County with nearby schools including Nelson Elementary School, Mulrennan Middle School, and Durant High School.
Ownership History
Date
Name
Owned For
Owner Type
Purchase Details
Closed on
Jan 31, 2018
Sold by
Arima Jesusa U and Arima Eric H
Bought by
Arima Eric H and Arima Jesusa U
Current Estimated Value
Purchase Details
Closed on
Dec 28, 2001
Sold by
Windward Homes C
Bought by
Arima Eric H and Arima Jesua U
Home Financials for this Owner
Home Financials are based on the most recent Mortgage that was taken out on this home.
Original Mortgage
$118,050
Outstanding Balance
$44,354
Interest Rate
6.49%
Mortgage Type
New Conventional
Estimated Equity
$257,990
Purchase Details
Closed on
Jul 10, 2001
Sold by
Kbc Dev C
Bought by
Windward Homes
Home Financials for this Owner
Home Financials are based on the most recent Mortgage that was taken out on this home.
Original Mortgage
$6,000,000
Interest Rate
7.17%
Mortgage Type
Credit Line Revolving
Create a Home Valuation Report for This Property
The Home Valuation Report is an in-depth analysis detailing your home's value as well as a comparison with similar homes in the area
Home Values in the Area
Average Home Value in this Area
Purchase History
| Date | Buyer | Sale Price | Title Company |
|---|---|---|---|
| Arima Eric H | -- | Attorney | |
| Arima Eric H | $110,400 | -- | |
| Windward Homes | $16,900 | -- |
Source: Public Records
Mortgage History
| Date | Status | Borrower | Loan Amount |
|---|---|---|---|
| Open | Windward Homes | $118,050 | |
| Previous Owner | Windward Homes | $6,000,000 |
Source: Public Records
Tax History
| Year | Tax Paid | Tax Assessment Tax Assessment Total Assessment is a certain percentage of the fair market value that is determined by local assessors to be the total taxable value of land and additions on the property. | Land | Improvement |
|---|---|---|---|---|
| 2025 | $4,026 | $215,363 | $52,756 | $162,607 |
| 2024 | $4,026 | $217,761 | $55,154 | $162,607 |
| 2023 | $3,646 | $189,796 | $47,960 | $141,836 |
| 2022 | $3,384 | $186,775 | $47,960 | $138,815 |
| 2021 | $3,011 | $143,581 | $33,572 | $110,009 |
| 2020 | $2,702 | $124,336 | $32,373 | $91,963 |
| 2019 | $2,908 | $121,567 | $33,572 | $87,995 |
| 2018 | $2,754 | $111,494 | $0 | $0 |
| 2017 | $2,660 | $105,523 | $0 | $0 |
| 2016 | $2,589 | $101,434 | $0 | $0 |
| 2015 | $2,466 | $92,313 | $0 | $0 |
| 2014 | $2,350 | $83,921 | $0 | $0 |
| 2013 | -- | $76,292 | $0 | $0 |
Source: Public Records
Map
Nearby Homes
- 755 Cape Cod Cir
- 630 Cape Cod Cir
- 807 Cape Cod Cir
- 837 Rocky Mountain Ct
- 605 Choo Ln Unit 503
- 3412 Palm Beach Dr
- 726 Choo Ln Unit 726F
- 3516 Zephyr Ln
- 3515 Zephyr Ln
- 3504 Meteor Place
- 914 Stallion Way
- 3508 Meteor Place Unit 3508MP
- 3602 Cinder Dr
- 3502 Petticoat Jct Unit 447
- 3526 Zephyr Ln Unit 3526ZL
- 3528 Zephyr Ln
- 3510 Petticoat Jct
- 4423 Horseshoe Pick Ln
- 930 Grand Canyon Dr
- 404 Boxcar Way Unit 557
- 727 Cape Cod Cir
- 728 Cape Cod Cir
- 721 Cape Cod Cir
- 722 Cape Cod Cir
- 724 Cape Cod Cir
- 716 Cape Cod Cir
- 726 Cape Cod Cir
- 714 Cape Cod Cir
- 738 Cape Cod Cir
- 719 Cape Cod Cir
- 717 Cape Cod Cir
- 725 Cape Cod Cir
- 703 Rocky Mountain Ct
- 718 Cape Cod Cir
- 705 Rocky Mountain Ct
- 712 Cape Cod Cir
- 730 Cape Cod Cir
- 715 Cape Cod Cir
- 732 Cape Cod Cir
Your Personal Tour Guide
Ask me questions while you tour the home.