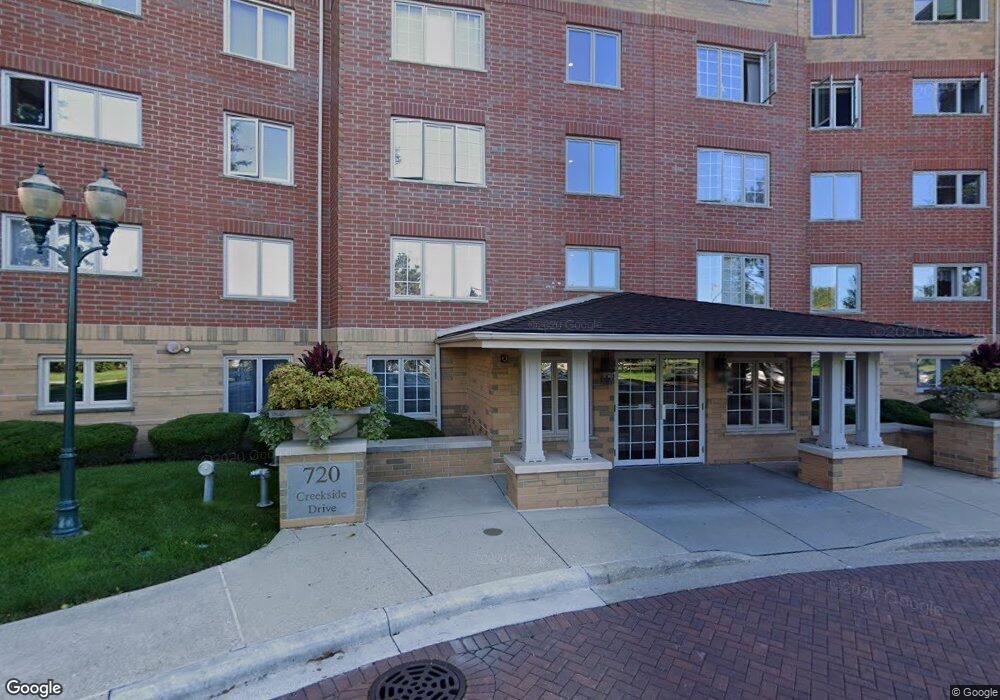
Creekside at Old Orchard 720 Creekside Dr Unit 204B Mount Prospect, IL 60056
North Mount Prospect NeighborhoodEstimated Value: $388,000 - $410,000
2
Beds
2
Baths
1,796
Sq Ft
$221/Sq Ft
Est. Value
About This Home
This home is located at 720 Creekside Dr Unit 204B, Mount Prospect, IL 60056 and is currently estimated at $397,263, approximately $221 per square foot. 720 Creekside Dr Unit 204B is a home located in Cook County with nearby schools including Dwight D Eisenhower Elementary School, Anne Sullivan Elementary School, and Betsy Ross Elementary School.
Ownership History
Date
Name
Owned For
Owner Type
Purchase Details
Closed on
May 29, 2012
Sold by
Leone Louis C
Bought by
Dzierzak Anthony and Dzierzak Jadwiga
Current Estimated Value
Purchase Details
Closed on
Nov 13, 2006
Sold by
Leone Louis C
Bought by
Leone Louis C and Louis C Leone Declaration Of Trust
Purchase Details
Closed on
Nov 10, 2005
Sold by
Karnatz William W and Karnatz Florence A
Bought by
Leone Louis C
Home Financials for this Owner
Home Financials are based on the most recent Mortgage that was taken out on this home.
Original Mortgage
$40,000
Interest Rate
6.2%
Mortgage Type
Fannie Mae Freddie Mac
Purchase Details
Closed on
Jan 16, 1998
Sold by
Karnatz William W and Karnatz Florence A
Bought by
Karnatz William W and Karnatz Florence A
Purchase Details
Closed on
Jun 2, 1997
Sold by
Parkway Bank & Trust Company
Bought by
Karnatz William W and Karnatz Florence A
Create a Home Valuation Report for This Property
The Home Valuation Report is an in-depth analysis detailing your home's value as well as a comparison with similar homes in the area
Home Values in the Area
Average Home Value in this Area
Purchase History
| Date | Buyer | Sale Price | Title Company |
|---|---|---|---|
| Dzierzak Anthony | $180,000 | Atgf Inc | |
| Leone Louis C | -- | None Available | |
| Leone Louis C | $321,000 | 1St American Title | |
| Karnatz William W | -- | -- | |
| Karnatz William W | $205,000 | -- |
Source: Public Records
Mortgage History
| Date | Status | Borrower | Loan Amount |
|---|---|---|---|
| Previous Owner | Leone Louis C | $40,000 |
Source: Public Records
Tax History Compared to Growth
Tax History
| Year | Tax Paid | Tax Assessment Tax Assessment Total Assessment is a certain percentage of the fair market value that is determined by local assessors to be the total taxable value of land and additions on the property. | Land | Improvement |
|---|---|---|---|---|
| 2024 | $7,324 | $31,973 | $1,192 | $30,781 |
| 2023 | $6,980 | $31,973 | $1,192 | $30,781 |
| 2022 | $6,980 | $31,973 | $1,192 | $30,781 |
| 2021 | $6,127 | $25,473 | $372 | $25,101 |
| 2020 | $6,098 | $25,473 | $372 | $25,101 |
| 2019 | $6,128 | $28,504 | $372 | $28,132 |
| 2018 | $4,718 | $21,788 | $298 | $21,490 |
| 2017 | $4,777 | $21,788 | $298 | $21,490 |
| 2016 | $4,984 | $21,788 | $298 | $21,490 |
| 2015 | $4,539 | $18,920 | $745 | $18,175 |
| 2014 | $4,497 | $18,920 | $745 | $18,175 |
| 2013 | $4,355 | $18,920 | $745 | $18,175 |
Source: Public Records
About Creekside at Old Orchard
Map
Nearby Homes
- 710 Creekside Dr Unit 506A
- 730 Creekside Dr Unit 405C
- 740 Creekside Dr Unit 510D
- 1428 N Bridgeport Dr Unit T37
- 1400 N Yarmouth Place Unit 113
- 1400 N Yarmouth Place Unit 315
- 802 Butternut Ln Unit C
- 802 Butternut Ln Unit D
- 211 W Hanover Place Unit T85
- 1401 Plum Ct Unit D
- 1311 Nutmeg Ct Unit A
- 910 Persimmon Ln Unit A
- 108 N Meadow Ln
- 1400 N Elmhurst Rd Unit 302
- 1400 N Elmhurst Rd Unit 106
- 107 W Brighton Place Unit T12
- 2700 E Bel Aire Dr Unit 104
- 2405 E Miner St
- 719 N Elmhurst Ave
- 2443 E Brandenberry Ct Unit 2A
- 720 Creekside Dr
- 720 Creekside Dr Unit 104B
- 720 Creekside Dr Unit 410B
- 720 Creekside Dr Unit 306B
- 720 Creekside Dr Unit 103B
- 720 Creekside Dr Unit 108B
- 720 Creekside Dr Unit 110B
- 720 Creekside Dr Unit 201B
- 720 Creekside Dr Unit 302B
- 720 Creekside Dr Unit 107B
- 720 Creekside Dr Unit 202B
- 720 Creekside Dr Unit 408B
- 720 Creekside Dr Unit 501B
- 720 Creekside Dr Unit 106B
- 720 Creekside Dr Unit 102B
- 720 Creekside Dr Unit 401B
- 720 Creekside Dr Unit 303B
- 720 Creekside Dr Unit 109B
- 720 Creekside Dr Unit 207B
- 720 Creekside Dr Unit 301B