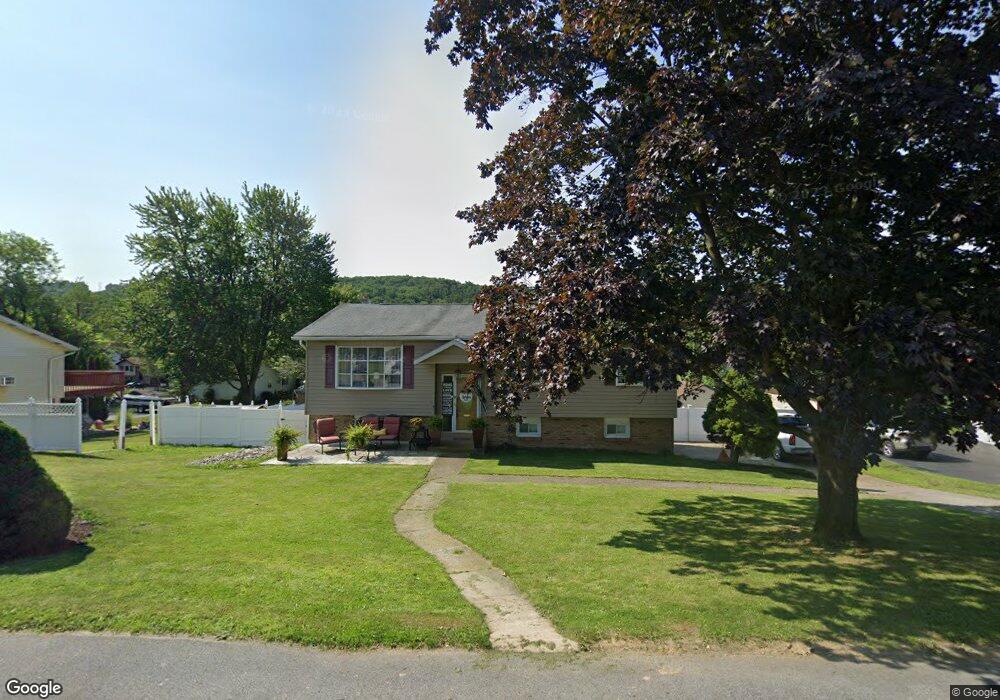
720 E Montgomery St Allentown, PA 18103
Southside NeighborhoodEstimated Value: $352,000 - $377,000
3
Beds
2
Baths
1,466
Sq Ft
$247/Sq Ft
Est. Value
About This Home
This home is located at 720 E Montgomery St, Allentown, PA 18103 and is currently estimated at $361,945, approximately $246 per square foot. 720 E Montgomery St is a home located in Lehigh County with nearby schools including Salisbury Elementary School, Salisbury Middle School, and Salisbury Senior High School.
Ownership History
Date
Name
Owned For
Owner Type
Purchase Details
Closed on
Sep 3, 2019
Sold by
Jarjous Joseph and Jarjous Iris
Bought by
Jarjous Iris
Current Estimated Value
Purchase Details
Closed on
May 30, 2003
Sold by
Kijak Mark M
Bought by
Jarjous Joseph and Jarjous Iris
Home Financials for this Owner
Home Financials are based on the most recent Mortgage that was taken out on this home.
Original Mortgage
$147,811
Outstanding Balance
$61,045
Interest Rate
5.83%
Mortgage Type
Purchase Money Mortgage
Estimated Equity
$300,900
Purchase Details
Closed on
May 18, 2000
Sold by
Kijak Mark M and Kijak Karen L
Bought by
Kijak Karen L
Purchase Details
Closed on
Sep 29, 1987
Sold by
Schatz Otto A and Schatz Vicky A
Bought by
Kijak Mark M and Kijak Karen L
Purchase Details
Closed on
Jul 28, 1982
Sold by
Mangold William C J
Bought by
Schatz Otto A and Schatz Vicky A
Create a Home Valuation Report for This Property
The Home Valuation Report is an in-depth analysis detailing your home's value as well as a comparison with similar homes in the area
Home Values in the Area
Average Home Value in this Area
Purchase History
| Date | Buyer | Sale Price | Title Company |
|---|---|---|---|
| Jarjous Iris | -- | Omega Abstract Company | |
| Jarjous Joseph | $149,900 | -- | |
| Kijak Karen L | -- | -- | |
| Kijak Mark M | $98,500 | -- | |
| Schatz Otto A | $64,500 | -- |
Source: Public Records
Mortgage History
| Date | Status | Borrower | Loan Amount |
|---|---|---|---|
| Open | Jarjous Joseph | $147,811 |
Source: Public Records
Tax History
| Year | Tax Paid | Tax Assessment Tax Assessment Total Assessment is a certain percentage of the fair market value that is determined by local assessors to be the total taxable value of land and additions on the property. | Land | Improvement |
|---|---|---|---|---|
| 2026 | $5,146 | $154,100 | $35,500 | $118,600 |
| 2025 | $4,853 | $154,100 | $35,500 | $118,600 |
| 2024 | $4,637 | $154,100 | $35,500 | $118,600 |
| 2023 | $4,399 | $154,100 | $35,500 | $118,600 |
| 2022 | $4,288 | $154,100 | $118,600 | $35,500 |
| 2021 | $4,116 | $154,100 | $35,500 | $118,600 |
| 2020 | $3,956 | $154,100 | $35,500 | $118,600 |
| 2019 | $3,812 | $154,100 | $35,500 | $118,600 |
| 2018 | $3,744 | $154,100 | $35,500 | $118,600 |
| 2017 | $3,648 | $154,100 | $35,500 | $118,600 |
| 2016 | -- | $154,100 | $35,500 | $118,600 |
| 2015 | -- | $154,100 | $35,500 | $118,600 |
| 2014 | -- | $154,100 | $35,500 | $118,600 |
Source: Public Records
Map
Nearby Homes
- 806 E Paoli St
- 2013 Woodside Ct
- 203 E Emmaus Ave
- 403 E Susquehanna St
- 127 E Lynnwood St
- 134 E Federal St
- 1513 S Albert St
- 1602 S Albert St Unit 1616
- 826 Whittier Dr
- 1350 E Susquehanna St
- 1216 Fretz Ave
- 1875-1879 S Wood St
- 2421 S Wood St
- 135 W Wabash St
- 134 W Montgomery St
- 210 W Wabash St
- 1533 E Emmaus Ave
- 1324 S 2nd St
- 329 W Brookdale St Unit 331
- 2328 S 4th St
- 712 E Montgomery St
- 732 E Montgomery St
- 721 E Wayne Ave
- 710 E Montgomery St
- 717 E Wayne Ave
- 725 E Wayne Ave
- 711 E Montgomery St
- 713 E Montgomery St
- 713 E Montgomery St
- 709 E Montgomery St
- 717 E Montgomery St
- 707 E Montgomery St
- 706 E Montgomery St
- 1903 S Halstead St
- 705 E Montgomery St
- 715 E Wayne Ave
- 803 E Wayne Ave
- 805 E Montgomery St
- 703 E Montgomery St
- 702 E Montgomery St
Your Personal Tour Guide
Ask me questions while you tour the home.