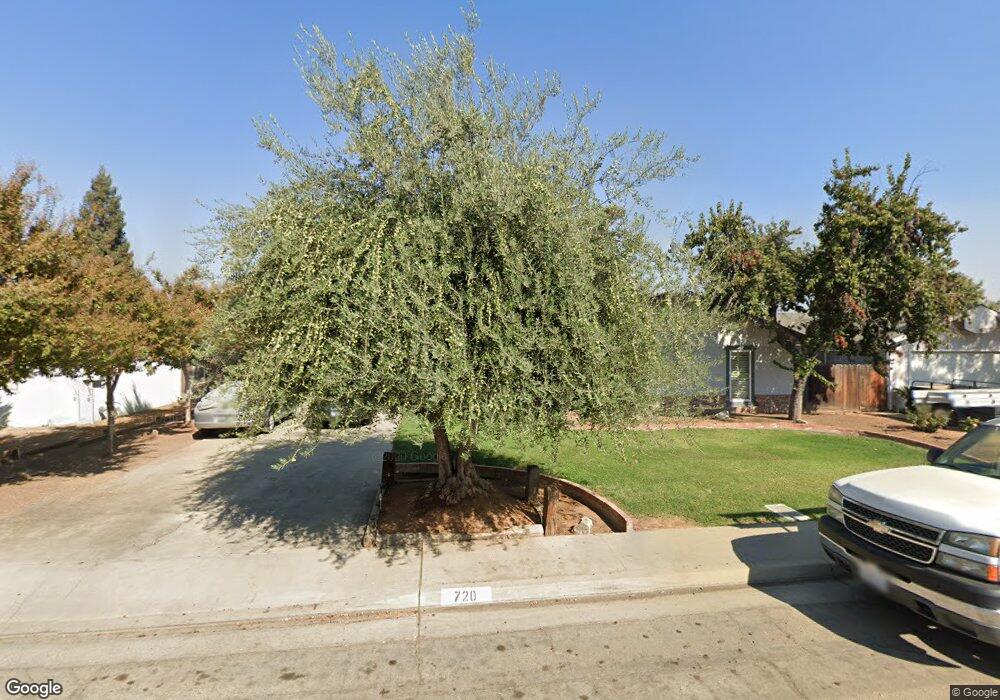
720 E Sycamore Ave Reedley, CA 93654
Estimated Value: $317,000 - $381,000
3
Beds
2
Baths
1,510
Sq Ft
$233/Sq Ft
Est. Value
About This Home
This home is located at 720 E Sycamore Ave, Reedley, CA 93654 and is currently estimated at $351,974, approximately $233 per square foot. 720 E Sycamore Ave is a home located in Fresno County with nearby schools including Thomas Law Reed Elementary School, Reedley High School, and Immanuel High School.
Ownership History
Date
Name
Owned For
Owner Type
Purchase Details
Closed on
Feb 13, 2017
Sold by
Fellows Celia Rose
Bought by
Fellows Celia Rose
Current Estimated Value
Purchase Details
Closed on
Dec 13, 2001
Sold by
West Donald P and West Suzanne
Bought by
Fellows Celia Rose
Home Financials for this Owner
Home Financials are based on the most recent Mortgage that was taken out on this home.
Original Mortgage
$118,750
Outstanding Balance
$47,915
Interest Rate
7.01%
Estimated Equity
$304,059
Purchase Details
Closed on
Mar 30, 1994
Sold by
Va
Bought by
Lovering Ralph P J and Lovering Julia M
Home Financials for this Owner
Home Financials are based on the most recent Mortgage that was taken out on this home.
Original Mortgage
$99,000
Interest Rate
4.62%
Purchase Details
Closed on
Mar 14, 1994
Sold by
Lovering Ralph P J and Lovering Julia M
Bought by
West Donald P and West Suzanne
Home Financials for this Owner
Home Financials are based on the most recent Mortgage that was taken out on this home.
Original Mortgage
$99,000
Interest Rate
4.62%
Create a Home Valuation Report for This Property
The Home Valuation Report is an in-depth analysis detailing your home's value as well as a comparison with similar homes in the area
Home Values in the Area
Average Home Value in this Area
Purchase History
| Date | Buyer | Sale Price | Title Company |
|---|---|---|---|
| Fellows Celia Rose | -- | None Available | |
| Fellows Celia Rose | $125,000 | Stewart Title Of Ca Inc | |
| Lovering Ralph P J | -- | Chicago Title | |
| West Donald P | $110,000 | Chicago Title Company |
Source: Public Records
Mortgage History
| Date | Status | Borrower | Loan Amount |
|---|---|---|---|
| Open | Fellows Celia Rose | $118,750 | |
| Previous Owner | West Donald P | $99,000 |
Source: Public Records
Tax History
| Year | Tax Paid | Tax Assessment Tax Assessment Total Assessment is a certain percentage of the fair market value that is determined by local assessors to be the total taxable value of land and additions on the property. | Land | Improvement |
|---|---|---|---|---|
| 2025 | $2,063 | $184,638 | $44,307 | $140,331 |
| 2023 | $2,016 | $177,471 | $42,588 | $134,883 |
| 2022 | $2,019 | $173,992 | $41,753 | $132,239 |
| 2021 | $1,973 | $170,582 | $40,935 | $129,647 |
| 2020 | $1,990 | $168,834 | $40,516 | $128,318 |
| 2019 | $1,934 | $165,524 | $39,722 | $125,802 |
| 2018 | $1,929 | $162,280 | $38,944 | $123,336 |
| 2017 | $1,836 | $159,099 | $38,181 | $120,918 |
| 2016 | $1,866 | $155,981 | $37,433 | $118,548 |
| 2015 | $1,801 | $153,639 | $36,871 | $116,768 |
| 2014 | $1,797 | $150,630 | $36,149 | $114,481 |
Source: Public Records
Map
Nearby Homes
- 714 E Ann Dr
- 723 N Lourae Ave
- 19326 E Parlier Ave
- 266 E Linden Ave
- 1405 E Cypress Ave Unit 157
- 1405 E Cypress Ave Unit 137
- 214 E Linden Ave
- 289 W Cypress Ave
- 574 N Frankwood Ave
- 2187 N Sunny Ln
- 1372 E Laroda Cir
- 1249 D St
- 216 S Sunset Ave
- 657 W Parlier Ave Unit 125
- 864 E Evening Glow Ave
- 1205 F St
- 259 E Evening Glow Cir
- 1185 E Evening Glow Ave
- 223 S Kady Ave
- 19342 E South Ave
- 748 E Sycamore Ave
- 702 E Sycamore Ave
- 725 E Cypress Ave
- 1241 N Steven Ave
- 688 E Sycamore Ave
- 705 E Cypress Ave
- 751 E Cypress Ave
- 727 E Sycamore Ave
- 705 E Sycamore Ave
- 751 E Sycamore Ave
- 673 E Cypress Ave
- 1281 N Steven Ave
- 656 E Sycamore Ave
- 673 E Sycamore Ave
- 1171 N Steven Ave
- 643 E Cypress Ave
- 643 E Sycamore Ave
- 626 E Sycamore Ave
- 714 E Cypress Ave
- 736 E Cypress Ave
Your Personal Tour Guide
Ask me questions while you tour the home.