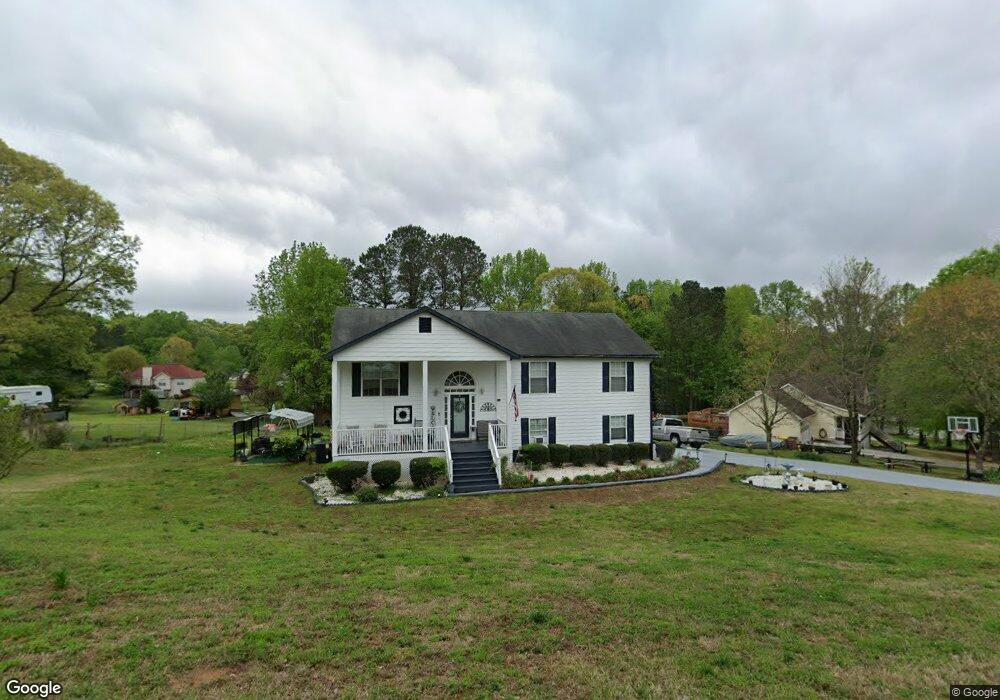
720 Kings Ct Unit 1 Bethlehem, GA 30620
Estimated Value: $313,000 - $384,000
5
Beds
3
Baths
2,254
Sq Ft
$157/Sq Ft
Est. Value
About This Home
This home is located at 720 Kings Ct Unit 1, Bethlehem, GA 30620 and is currently estimated at $353,757, approximately $156 per square foot. 720 Kings Ct Unit 1 is a home located in Barrow County with nearby schools including Yargo Elementary School, Haymon-Morris Middle School, and Apalachee High School.
Ownership History
Date
Name
Owned For
Owner Type
Purchase Details
Closed on
Mar 27, 2020
Sold by
Hosch Tymesha D
Bought by
Candis Donna A
Current Estimated Value
Purchase Details
Closed on
Aug 23, 2013
Sold by
Taylor Denise
Bought by
Candis Donna A and Hosch Tymesha D
Home Financials for this Owner
Home Financials are based on the most recent Mortgage that was taken out on this home.
Original Mortgage
$77,077
Interest Rate
4.4%
Mortgage Type
FHA
Purchase Details
Closed on
Sep 16, 2008
Sold by
Vanfleet Geneva
Bought by
Taylor Denise C
Home Financials for this Owner
Home Financials are based on the most recent Mortgage that was taken out on this home.
Original Mortgage
$137,193
Interest Rate
6.45%
Mortgage Type
FHA
Purchase Details
Closed on
Dec 13, 2004
Sold by
Vanfleet Roger C. A
Bought by
Vanfleet Geneva
Purchase Details
Closed on
Oct 6, 1994
Sold by
Wt'S Home Builders
Bought by
Vanfleet Roger C. A
Purchase Details
Closed on
Jan 10, 1994
Sold by
Lwl Inc
Bought by
Wt'S Home Builders
Create a Home Valuation Report for This Property
The Home Valuation Report is an in-depth analysis detailing your home's value as well as a comparison with similar homes in the area
Home Values in the Area
Average Home Value in this Area
Purchase History
| Date | Buyer | Sale Price | Title Company |
|---|---|---|---|
| Candis Donna A | -- | -- | |
| Candis Donna A | $78,500 | -- | |
| Taylor Denise C | $139,700 | -- | |
| Vanfleet Geneva | -- | -- | |
| Vanfleet Roger C. A | $99,200 | -- | |
| Wt'S Home Builders | $14,000 | -- |
Source: Public Records
Mortgage History
| Date | Status | Borrower | Loan Amount |
|---|---|---|---|
| Previous Owner | Candis Donna A | $77,077 | |
| Previous Owner | Taylor Denise C | $137,193 |
Source: Public Records
Tax History
| Year | Tax Paid | Tax Assessment Tax Assessment Total Assessment is a certain percentage of the fair market value that is determined by local assessors to be the total taxable value of land and additions on the property. | Land | Improvement |
|---|---|---|---|---|
| 2025 | $689 | $89,465 | $23,200 | $66,265 |
| 2024 | $886 | $87,679 | $23,200 | $64,479 |
| 2023 | $641 | $88,079 | $23,200 | $64,879 |
| 2022 | $794 | $79,321 | $23,200 | $56,121 |
| 2021 | $664 | $61,432 | $16,000 | $45,432 |
| 2020 | $666 | $61,432 | $16,000 | $45,432 |
| 2019 | $697 | $61,432 | $16,000 | $45,432 |
| 2018 | $1,764 | $61,170 | $13,600 | $47,570 |
| 2017 | $1,482 | $50,891 | $13,600 | $37,291 |
| 2016 | $1,380 | $49,495 | $13,600 | $35,895 |
| 2015 | $1,399 | $49,937 | $13,600 | $36,337 |
| 2014 | $1,002 | $45,250 | $6,664 | $38,586 |
| 2013 | -- | $43,321 | $6,664 | $36,657 |
Source: Public Records
Map
Nearby Homes
- 724 Westbury Dr
- 720 Westbury Ct
- 738 Worth Ct
- 713 Carl Bethlehem Rd
- 746 Morris Ln
- 923 Downing Dr
- 907 Downing Dr
- 829 Kendall Park Dr
- 834 Kendall Park Dr Unit 1
- 611 Mcdowell Ln
- 1111 Otis Dr
- 1202 Benton Ct
- 1583 Pointe South Cir
- 1587 Pointe South Cir
- 1562 Pointe South Cir
- 1411 Silvergate Way
- 1412 Silvergate Way
- 627 Bridle Creek Dr
- 297 Rydal Way
- 209 Angie Way
- 720 Kings Ct
- 720 Kings Ct
- 716 Kings Ct Unit 1
- 724 Kings Ct
- 721 Kings Ct Unit 1
- 714 Kings Ct Unit 1
- 717 Kings Ct
- 721 Westbury Dr
- 723 Kings Ct Unit 1
- 719 Westbury Dr
- 726 Kings Ct Unit 1
- 719 Kings Ct
- 725 Kings Ct Unit 1
- 717 Westbury Dr
- 723 Westbury Dr
- 712 Kings Ct
- 715 Kings Ct
- 715 Kings Ct
- 715 Westbury Dr Unit 2
- 727 Kings Ct
Your Personal Tour Guide
Ask me questions while you tour the home.