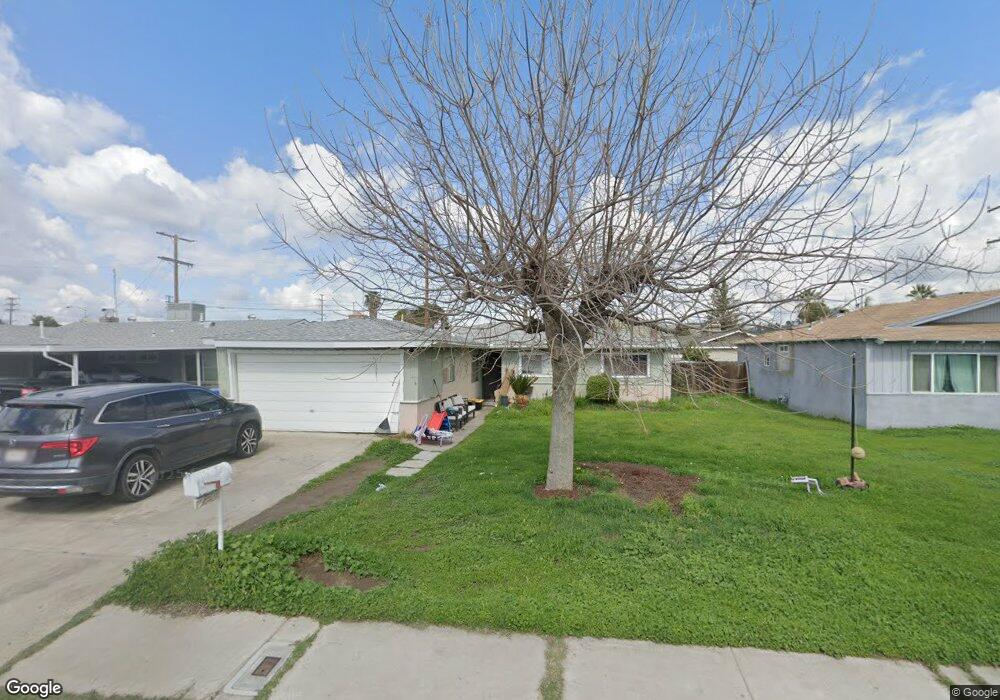
720 Oakmont Ave Porterville, CA 93257
Porterville Northwest NeighborhoodEstimated Value: $283,120 - $306,000
3
Beds
2
Baths
1,242
Sq Ft
$237/Sq Ft
Est. Value
About This Home
This home is located at 720 Oakmont Ave, Porterville, CA 93257 and is currently estimated at $293,780, approximately $236 per square foot. 720 Oakmont Ave is a home located in Tulare County with nearby schools including Belleview Elementary School, Bartlett Middle School, and Granite Hills High School.
Ownership History
Date
Name
Owned For
Owner Type
Purchase Details
Closed on
Apr 11, 2018
Sold by
Mendoza Javier and Mendoza Robertina
Bought by
Mendoza Paulina
Current Estimated Value
Purchase Details
Closed on
Jul 16, 2010
Sold by
Federal Home Loan Mortgage Corporation
Bought by
Mendoza Javier and Mendoza Robertina
Home Financials for this Owner
Home Financials are based on the most recent Mortgage that was taken out on this home.
Original Mortgage
$93,737
Interest Rate
4.38%
Mortgage Type
FHA
Purchase Details
Closed on
Feb 17, 2010
Sold by
Galindo Alejandra
Bought by
Federal Home Loan Mortgage Corporation
Purchase Details
Closed on
Nov 7, 2005
Sold by
Seaton Celia A
Bought by
Galindo Alejandra
Home Financials for this Owner
Home Financials are based on the most recent Mortgage that was taken out on this home.
Original Mortgage
$161,500
Interest Rate
5.75%
Mortgage Type
Fannie Mae Freddie Mac
Purchase Details
Closed on
Dec 11, 1995
Sold by
Seaton Celia A
Bought by
Seaton Celia A
Create a Home Valuation Report for This Property
The Home Valuation Report is an in-depth analysis detailing your home's value as well as a comparison with similar homes in the area
Home Values in the Area
Average Home Value in this Area
Purchase History
| Date | Buyer | Sale Price | Title Company |
|---|---|---|---|
| Mendoza Paulina | -- | None Available | |
| Mendoza Javier | $95,000 | None Available | |
| Federal Home Loan Mortgage Corporation | $139,000 | Accommodation | |
| Galindo Alejandra | $211,500 | -- | |
| Seaton Celia A | -- | -- |
Source: Public Records
Mortgage History
| Date | Status | Borrower | Loan Amount |
|---|---|---|---|
| Previous Owner | Mendoza Javier | $93,737 | |
| Previous Owner | Galindo Alejandra | $161,500 |
Source: Public Records
Tax History Compared to Growth
Tax History
| Year | Tax Paid | Tax Assessment Tax Assessment Total Assessment is a certain percentage of the fair market value that is determined by local assessors to be the total taxable value of land and additions on the property. | Land | Improvement |
|---|---|---|---|---|
| 2025 | $1,293 | $121,708 | $32,026 | $89,682 |
| 2024 | $1,293 | $119,323 | $31,399 | $87,924 |
| 2023 | $1,291 | $116,984 | $30,784 | $86,200 |
| 2022 | $1,252 | $114,691 | $30,181 | $84,510 |
| 2021 | $1,237 | $112,442 | $29,589 | $82,853 |
| 2020 | $1,224 | $111,289 | $29,286 | $82,003 |
| 2019 | $1,202 | $109,107 | $28,712 | $80,395 |
| 2018 | $1,103 | $106,968 | $28,149 | $78,819 |
| 2017 | $1,074 | $104,871 | $27,597 | $77,274 |
| 2016 | $1,030 | $102,815 | $27,056 | $75,759 |
| 2015 | -- | $101,271 | $26,650 | $74,621 |
| 2014 | -- | $99,287 | $26,128 | $73,159 |
Source: Public Records
Map
Nearby Homes
- 572 Memory Ln
- 816 W Grand Ave
- 824 W Grand Ave
- 670 W Kanai Ave
- 701 Theta Ave
- 701 W Theta Ave
- 579 N Villa St
- 927 Shadowood Place
- 643 W Belleview Ave
- 479 W Grand Ave
- 681 W Mulberry Ave
- 590 W Morton Ave
- 347 Ohio Cir
- 680 W Gerry Cir
- 361 W Grand Ave
- 1060 W Belleview Ave
- 293 N Villa St
- 292 N Villa St
- 1087 W Belleview Ave
- 474 Douglas St
- 710 Oakmont Ave
- 728 Oakmont Ave
- 719 Dexter Ave
- 740 W 0akmont
- 733 Dexter Ave
- 719 W Dexter
- 702 Oakmont Ave
- 740 Oakmont Ave
- 733 W Dexter
- 719 Oakmont Ave
- 711 Dexter Ave
- 741 Dexter Ave
- 701 Dexter Ave
- 711 Oakmont Ave
- 741 W Dexter
- 727 Oakmont Ave
- 692 Oakmont Ave
- 701 Oakmont Ave
- 741 Oakmont Ave
- 695 Dexter Ave