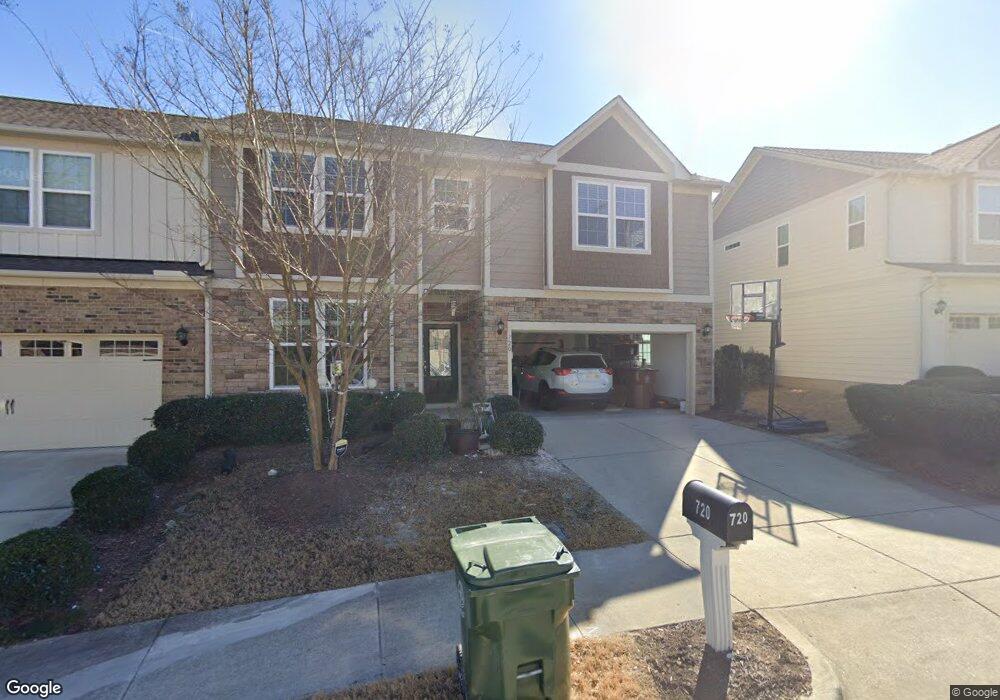
720 Transom View Way Cary, NC 27519
Cary Park NeighborhoodEstimated Value: $555,000 - $612,000
4
Beds
3
Baths
2,526
Sq Ft
$231/Sq Ft
Est. Value
About This Home
This home is located at 720 Transom View Way, Cary, NC 27519 and is currently estimated at $584,702, approximately $231 per square foot. 720 Transom View Way is a home located in Wake County with nearby schools including Mills Park Elementary School, Mills Park Middle School, and Green Level High School.
Ownership History
Date
Name
Owned For
Owner Type
Purchase Details
Closed on
Jun 16, 2021
Sold by
Tiwari Sourabh and Pandey Smita
Bought by
Tiwari Sourabh and Pandey Smita
Current Estimated Value
Purchase Details
Closed on
Jun 28, 2017
Sold by
Green Nathan and Green April
Bought by
Tiwari Sourabh and Pandey Smita
Home Financials for this Owner
Home Financials are based on the most recent Mortgage that was taken out on this home.
Original Mortgage
$297,000
Outstanding Balance
$241,567
Interest Rate
3.5%
Mortgage Type
Adjustable Rate Mortgage/ARM
Estimated Equity
$343,135
Purchase Details
Closed on
Oct 4, 2013
Sold by
Cary Park Townhomes Ii Llc
Bought by
Green Nathan and Green April
Home Financials for this Owner
Home Financials are based on the most recent Mortgage that was taken out on this home.
Original Mortgage
$258,362
Interest Rate
4.57%
Mortgage Type
New Conventional
Create a Home Valuation Report for This Property
The Home Valuation Report is an in-depth analysis detailing your home's value as well as a comparison with similar homes in the area
Home Values in the Area
Average Home Value in this Area
Purchase History
| Date | Buyer | Sale Price | Title Company |
|---|---|---|---|
| Tiwari Sourabh | -- | None Available | |
| Tiwari Sourabh | $332,500 | None Available | |
| Green Nathan | $272,000 | None Available |
Source: Public Records
Mortgage History
| Date | Status | Borrower | Loan Amount |
|---|---|---|---|
| Open | Tiwari Sourabh | $297,000 | |
| Previous Owner | Green Nathan | $258,362 |
Source: Public Records
Tax History
| Year | Tax Paid | Tax Assessment Tax Assessment Total Assessment is a certain percentage of the fair market value that is determined by local assessors to be the total taxable value of land and additions on the property. | Land | Improvement |
|---|---|---|---|---|
| 2025 | $4,720 | $548,357 | $130,000 | $418,357 |
| 2024 | $4,618 | $548,357 | $130,000 | $418,357 |
Source: Public Records
Map
Nearby Homes
- 399 Waverly Hills Dr
- 406 Waverly Hills Dr
- 309 Bridgegate Dr
- 371 Bridgegate Dr
- 237 Tidal Pool Way
- 250 Tidal Pool Way
- 222 Tidal Pool Way
- 147 Rivulet Ct
- 160 Rivulet Ct
- 133 Keythorpe Ln
- Newport Plan at Hidden Creek
- Sheridan Plan at Hidden Creek
- Hamilton Plan at Hidden Creek
- Wayland Plan at Hidden Creek
- Ashford Plan at Hidden Creek
- 1404 Montvale Ridge Dr
- 321 Belles Landing Ct
- 307 Lantern Ridge Ln
- 307 Belles Landing Ct
- 832 Money Island Place
- 722 Transom View Way
- 724 Transom View Way
- 513 Alden Bridge Dr
- 511 Alden Bridge Dr
- 716 Transom View Way
- 517 Alden Bridge Dr
- 515 Alden Bridge Dr
- 725 Transom View Way
- 509 Alden Bridge Dr
- 719 Transom View Way
- 714 Transom View Way
- 726 Transom View Way
- 519 Alden Bridge Dr
- 727 Transom View Way
- 507 Alden Bridge Dr
- 721 Transom View Way
- 718 Transom View Way
- 715 Transom View Way
- 712 Transom View Way
- 505 Alden Bridge Dr
Your Personal Tour Guide
Ask me questions while you tour the home.