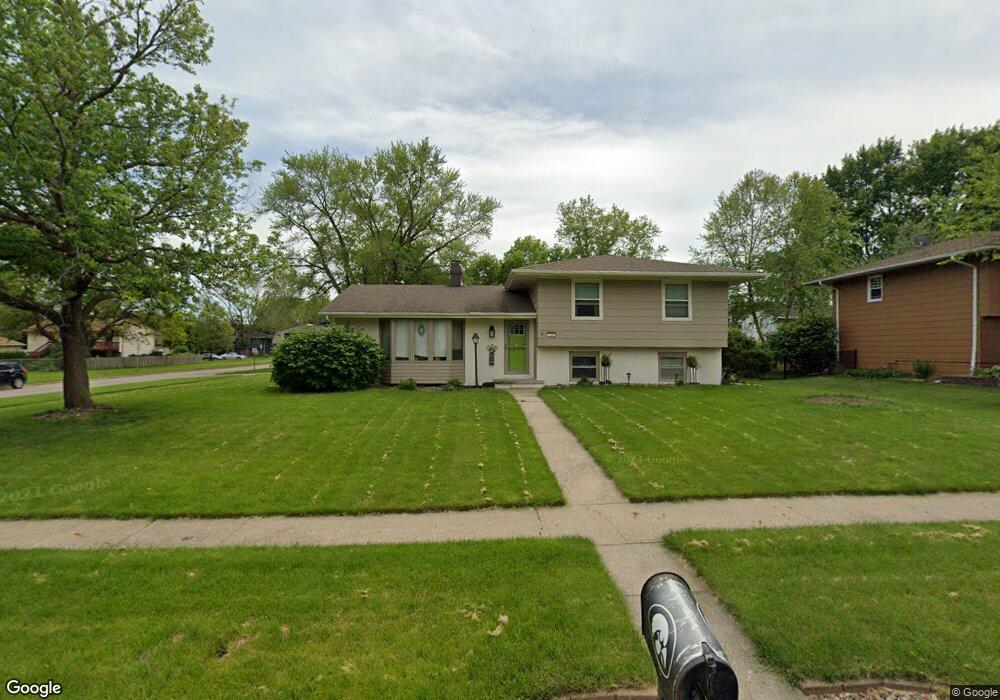
7200 Townsend Ave Urbandale, IA 50322
Estimated Value: $336,000 - $358,000
3
Beds
3
Baths
1,483
Sq Ft
$233/Sq Ft
Est. Value
About This Home
This home is located at 7200 Townsend Ave, Urbandale, IA 50322 and is currently estimated at $345,466, approximately $232 per square foot. 7200 Townsend Ave is a home located in Polk County with nearby schools including Olmsted Elementary School, Urbandale Middle School, and Urbandale High School.
Ownership History
Date
Name
Owned For
Owner Type
Purchase Details
Closed on
Jun 3, 2005
Sold by
Lantz Terry W and Lantz Beverly J
Bought by
Canine Mike D and Canine Teresa K
Current Estimated Value
Home Financials for this Owner
Home Financials are based on the most recent Mortgage that was taken out on this home.
Original Mortgage
$160,400
Outstanding Balance
$83,526
Interest Rate
5.82%
Mortgage Type
Fannie Mae Freddie Mac
Estimated Equity
$261,940
Create a Home Valuation Report for This Property
The Home Valuation Report is an in-depth analysis detailing your home's value as well as a comparison with similar homes in the area
Home Values in the Area
Average Home Value in this Area
Purchase History
| Date | Buyer | Sale Price | Title Company |
|---|---|---|---|
| Canine Mike D | $168,500 | -- |
Source: Public Records
Mortgage History
| Date | Status | Borrower | Loan Amount |
|---|---|---|---|
| Open | Canine Mike D | $160,400 |
Source: Public Records
Tax History Compared to Growth
Tax History
| Year | Tax Paid | Tax Assessment Tax Assessment Total Assessment is a certain percentage of the fair market value that is determined by local assessors to be the total taxable value of land and additions on the property. | Land | Improvement |
|---|---|---|---|---|
| 2025 | $5,628 | $340,400 | $70,200 | $270,200 |
| 2024 | $5,628 | $321,200 | $65,500 | $255,700 |
| 2023 | $5,122 | $321,200 | $65,500 | $255,700 |
| 2022 | $5,062 | $247,600 | $52,000 | $195,600 |
| 2021 | $5,156 | $247,600 | $52,000 | $195,600 |
| 2020 | $5,066 | $239,400 | $50,200 | $189,200 |
| 2019 | $4,700 | $239,400 | $50,200 | $189,200 |
| 2018 | $4,524 | $212,900 | $43,800 | $169,100 |
| 2017 | $4,220 | $212,900 | $43,800 | $169,100 |
| 2016 | $4,112 | $195,700 | $39,500 | $156,200 |
| 2015 | $4,112 | $195,700 | $39,500 | $156,200 |
| 2014 | $3,908 | $192,200 | $38,600 | $153,600 |
Source: Public Records
Map
Nearby Homes