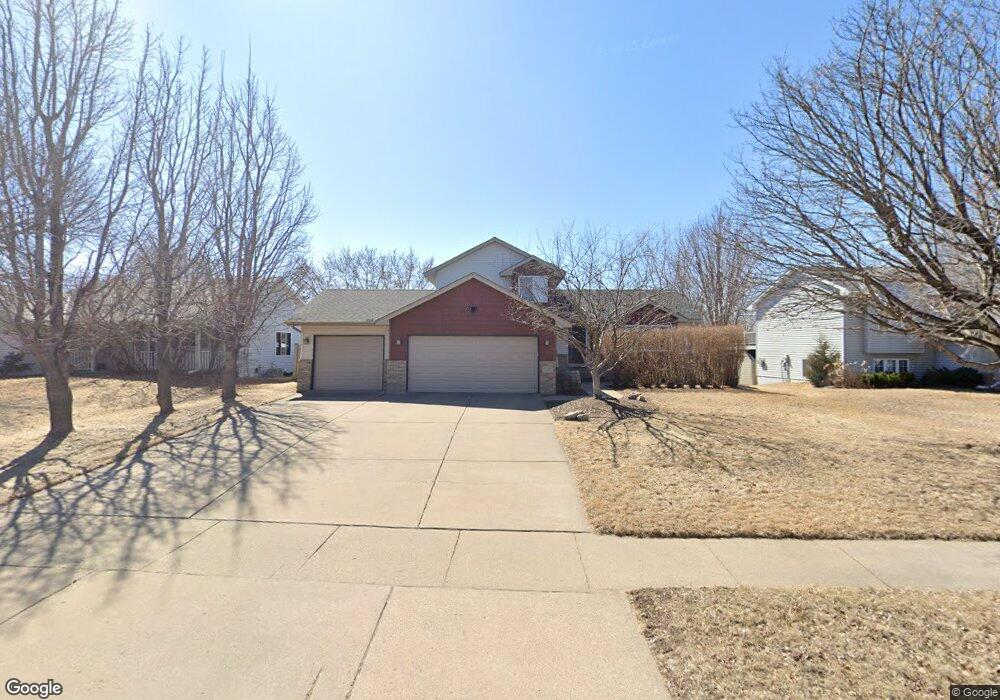
7201 90th Trail N Brooklyn Park, MN 55445
Tessman NeighborhoodEstimated Value: $397,617 - $449,000
3
Beds
2
Baths
1,962
Sq Ft
$214/Sq Ft
Est. Value
About This Home
This home is located at 7201 90th Trail N, Brooklyn Park, MN 55445 and is currently estimated at $418,904, approximately $213 per square foot. 7201 90th Trail N is a home located in Hennepin County with nearby schools including Edinbrook Elementary School, North View Middle School, and Osseo Senior High School.
Ownership History
Date
Name
Owned For
Owner Type
Purchase Details
Closed on
Dec 2, 2019
Sold by
Weiland Tyler and Weiland Tana Lee
Bought by
Schneider Heather M
Current Estimated Value
Home Financials for this Owner
Home Financials are based on the most recent Mortgage that was taken out on this home.
Original Mortgage
$299,475
Outstanding Balance
$263,457
Interest Rate
3.49%
Mortgage Type
FHA
Estimated Equity
$155,447
Purchase Details
Closed on
Jun 17, 2016
Sold by
Moua Kong and Moua Bao
Bought by
Weiland Tyler and Weiland Tana Lee
Home Financials for this Owner
Home Financials are based on the most recent Mortgage that was taken out on this home.
Original Mortgage
$241,052
Interest Rate
3.5%
Mortgage Type
FHA
Purchase Details
Closed on
Jul 9, 2009
Sold by
Selin Vicky Marie
Bought by
Moua Kong and Moua Bao
Purchase Details
Closed on
Sep 30, 1999
Sold by
Roach Michael Paul and Roach Donna J
Bought by
Selin Duane K and Selin Vicky M
Create a Home Valuation Report for This Property
The Home Valuation Report is an in-depth analysis detailing your home's value as well as a comparison with similar homes in the area
Home Values in the Area
Average Home Value in this Area
Purchase History
| Date | Buyer | Sale Price | Title Company |
|---|---|---|---|
| Schneider Heather M | $305,000 | Titlesmart Inc | |
| Weiland Tyler | $245,500 | First American Title Co | |
| Moua Kong | $217,500 | -- | |
| Selin Duane K | $163,000 | -- |
Source: Public Records
Mortgage History
| Date | Status | Borrower | Loan Amount |
|---|---|---|---|
| Open | Schneider Heather M | $299,475 | |
| Previous Owner | Weiland Tyler | $241,052 |
Source: Public Records
Tax History Compared to Growth
Tax History
| Year | Tax Paid | Tax Assessment Tax Assessment Total Assessment is a certain percentage of the fair market value that is determined by local assessors to be the total taxable value of land and additions on the property. | Land | Improvement |
|---|---|---|---|---|
| 2024 | $5,379 | $377,400 | $120,000 | $257,400 |
| 2023 | $5,147 | $375,100 | $120,000 | $255,100 |
| 2022 | $4,323 | $393,500 | $120,000 | $273,500 |
| 2021 | $4,246 | $315,000 | $68,000 | $247,000 |
| 2020 | $4,289 | $310,700 | $68,000 | $242,700 |
| 2019 | $4,173 | $298,000 | $68,000 | $230,000 |
| 2018 | $3,970 | $276,900 | $60,200 | $216,700 |
| 2017 | $3,777 | $240,900 | $60,200 | $180,700 |
| 2016 | $3,681 | $232,300 | $60,200 | $172,100 |
| 2015 | $3,541 | $219,000 | $50,200 | $168,800 |
| 2014 | -- | $206,100 | $50,200 | $155,900 |
Source: Public Records
Map
Nearby Homes
- 9007 Hampshire Ave N
- 6601 89th Ave N
- 8740 N Maplebrook Cir
- 6508 88th Ave N
- 8858 N Maplebrook Ct
- 8657 Tessman Cir N
- 8614 Tessman Pkwy N
- 8775 Maplebrook Pkwy N
- 8833 N Maplebrook Ct
- 8614 Tessman Ct N
- 6419 Tessman Terrace N
- 6236 Creekview Ln N
- 8357 Jersey Ave N
- 6614 84th Ct N
- 6017 Creekview Ln N
- 6404 84th Ct N
- 6523 84th Ct N Unit 6523
- 7929 85th Ct N
- 6716 83rd Ave N
- 6526 83rd Ct N
- 7117 90th Trail N
- 7209 90th Trail N
- 7109 90th Trail N
- 7217 90th Trail N
- 7132 90th Ave N
- 7200 90th Ave N
- 7124 90th Ave N
- 7200 90th Trail N
- 7101 90th Trail N
- 7208 90th Trail N
- 7225 90th Trail N
- 7108 90th Trail N
- 7116 90th Ave N
- 7216 90th Trail N
- 7100 90th Trail N
- 7108 90th Ave N
- 7209 90th Ave N
- 9007 Kentucky Ave N
- 7301 90th Trail N
- 7109 Setzler Pkwy