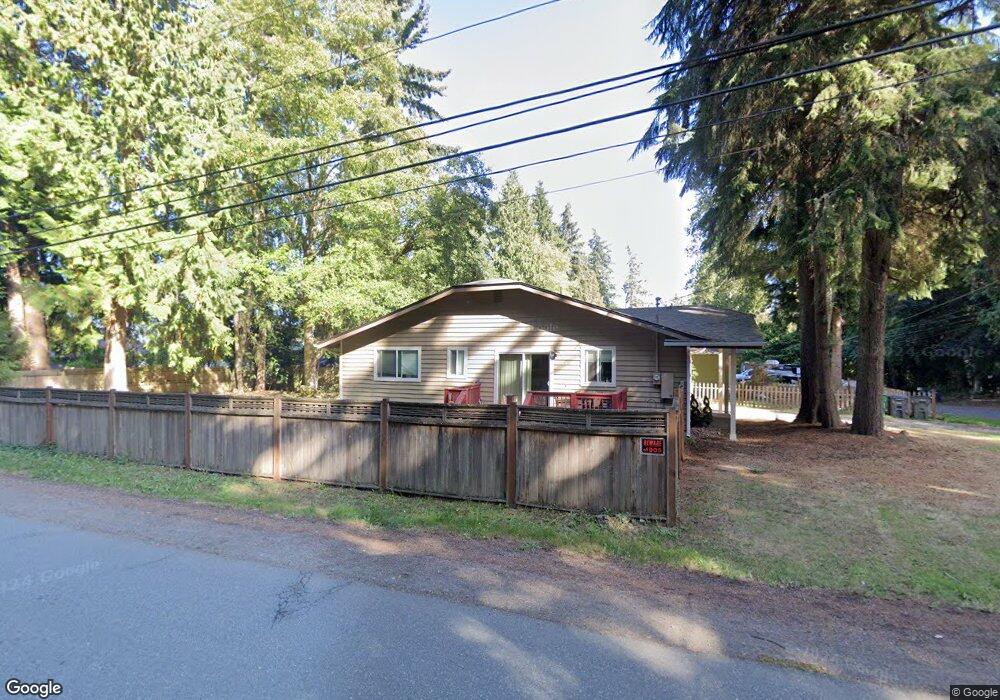
7201 E Fir St Port Orchard, WA 98366
Manchester NeighborhoodEstimated Value: $424,000 - $449,000
3
Beds
2
Baths
1,035
Sq Ft
$422/Sq Ft
Est. Value
About This Home
This home is located at 7201 E Fir St, Port Orchard, WA 98366 and is currently estimated at $436,350, approximately $421 per square foot. 7201 E Fir St is a home located in Kitsap County with nearby schools including Manchester Elementary School, John Sedgwick Middle School, and South Kitsap High School.
Ownership History
Date
Name
Owned For
Owner Type
Purchase Details
Closed on
Apr 21, 2021
Sold by
Watson Derek B and Watson Robin R
Bought by
Wittig Jakob C
Current Estimated Value
Home Financials for this Owner
Home Financials are based on the most recent Mortgage that was taken out on this home.
Original Mortgage
$310,000
Outstanding Balance
$280,117
Interest Rate
3.05%
Mortgage Type
New Conventional
Estimated Equity
$156,234
Purchase Details
Closed on
Oct 20, 2020
Sold by
Burt Sarah N
Bought by
Dayton Jamie L
Home Financials for this Owner
Home Financials are based on the most recent Mortgage that was taken out on this home.
Original Mortgage
$276,000
Interest Rate
2.8%
Mortgage Type
New Conventional
Purchase Details
Closed on
Jun 15, 2012
Sold by
Watkins David
Bought by
Burt Sarah N
Home Financials for this Owner
Home Financials are based on the most recent Mortgage that was taken out on this home.
Original Mortgage
$188,775
Interest Rate
3.74%
Mortgage Type
New Conventional
Create a Home Valuation Report for This Property
The Home Valuation Report is an in-depth analysis detailing your home's value as well as a comparison with similar homes in the area
Home Values in the Area
Average Home Value in this Area
Purchase History
| Date | Buyer | Sale Price | Title Company |
|---|---|---|---|
| Wittig Jakob C | $387,500 | Land Ttl Co Silverdale Submi | |
| Dayton Jamie L | $345,000 | Land Title Co Silverdale | |
| Burt Sarah N | $185,280 | Pacific Nw Title |
Source: Public Records
Mortgage History
| Date | Status | Borrower | Loan Amount |
|---|---|---|---|
| Open | Wittig Jakob C | $310,000 | |
| Previous Owner | Dayton Jamie L | $276,000 | |
| Previous Owner | Burt Sarah N | $188,775 |
Source: Public Records
Tax History Compared to Growth
Tax History
| Year | Tax Paid | Tax Assessment Tax Assessment Total Assessment is a certain percentage of the fair market value that is determined by local assessors to be the total taxable value of land and additions on the property. | Land | Improvement |
|---|---|---|---|---|
| 2026 | $3,258 | $371,840 | $90,000 | $281,840 |
| 2025 | $3,258 | $371,840 | $90,000 | $281,840 |
| 2024 | $3,160 | $371,840 | $90,000 | $281,840 |
| 2023 | $3,136 | $371,840 | $90,000 | $281,840 |
| 2022 | $2,997 | $297,350 | $71,880 | $225,470 |
| 2021 | $2,764 | $259,190 | $62,500 | $196,690 |
| 2020 | $2,461 | $223,400 | $58,110 | $165,290 |
| 2019 | $2,120 | $211,240 | $54,930 | $156,310 |
| 2018 | $2,217 | $166,590 | $47,670 | $118,920 |
| 2017 | $1,844 | $166,590 | $47,670 | $118,920 |
| 2016 | $1,763 | $145,620 | $45,400 | $100,220 |
| 2015 | $1,704 | $142,740 | $45,400 | $97,340 |
| 2014 | -- | $132,190 | $46,160 | $86,030 |
| 2013 | -- | $132,190 | $46,160 | $86,030 |
Source: Public Records
Map
Nearby Homes
- 7230 E Maple St
- 7548 E Grandview St
- 2440 Alaska Ave E
- 1738 Lilypad Place E
- 2585 Alaska Ave E
- 7748 E Hemlock St
- 2372 Valley Ave E
- 6418 E Royalview Ln
- 7000 E Dakota St
- 7260 E Last Refuge Way
- 7549 E Alki View Ct
- 7041 E Washington St
- 7590 E Idaho St
- 7579 E Idaho St
- 8079 E Main St Unit 341
- 7569 E Montana St
- 7081 E Bullseye St
- 7057 E Bullseye St
- 6997 E Bullseye St
- 7058 E Nightingale St
- 7215 E Fir St
- 2283 California Ave E
- 7229 E Fir St
- 7206 E Manders Way
- 2247 California Ave E
- 2250 California Ave E
- 7243 E Fir St
- 7230 E Fir St
- 2274 California Ave E
- 2301 California Ave E
- 7277 E Fir St
- 7277 E Fir St
- 2201 California Ave E
- 7280 E Fir St
- 2198 California Ave E
- 7229 E Maple St
- 99999 E E Manders Way
- 7257 E Fir St
- 2264 California Ave E
- 2307 California Ave E