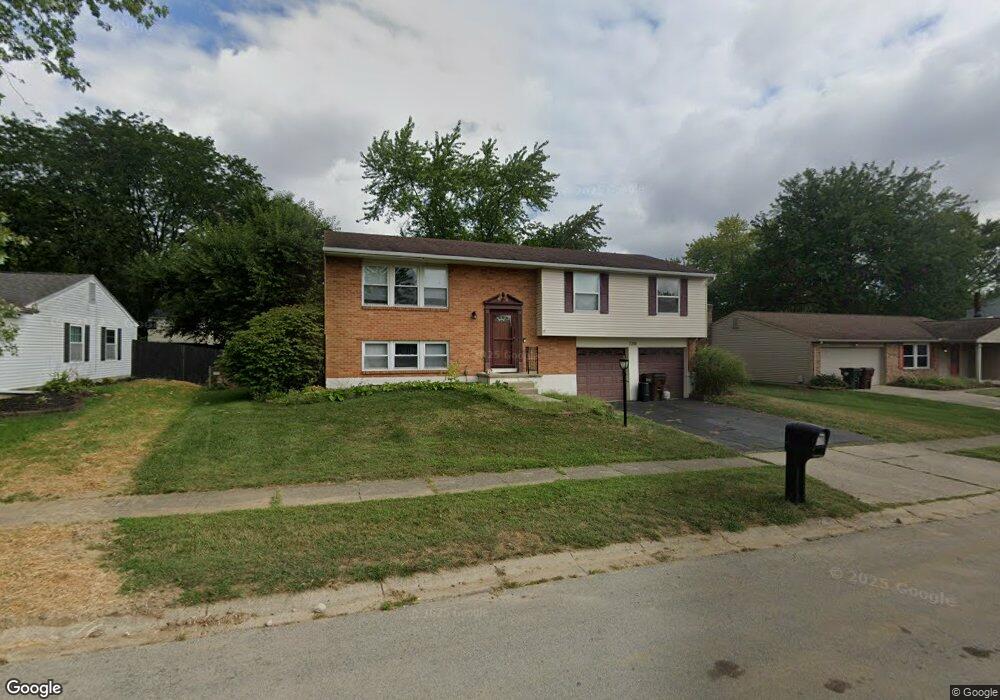
7201 Robert Ulrich Ave Dayton, OH 45415
Estimated Value: $239,563 - $277,000
3
Beds
3
Baths
1,296
Sq Ft
$197/Sq Ft
Est. Value
About This Home
This home is located at 7201 Robert Ulrich Ave, Dayton, OH 45415 and is currently estimated at $255,141, approximately $196 per square foot. 7201 Robert Ulrich Ave is a home located in Montgomery County with nearby schools including Northwood Elementary School, Northmont High School, and Trotwood Preparatory & Fitness Academy.
Ownership History
Date
Name
Owned For
Owner Type
Purchase Details
Closed on
Jan 3, 2022
Sold by
Collins Stephen D and Collins Tammy L
Bought by
Anderson Robert G and Anderson Gabrielle E
Current Estimated Value
Home Financials for this Owner
Home Financials are based on the most recent Mortgage that was taken out on this home.
Original Mortgage
$181,649
Outstanding Balance
$167,412
Interest Rate
3.11%
Mortgage Type
FHA
Estimated Equity
$87,729
Purchase Details
Closed on
Oct 1, 2001
Sold by
Lloyd Rachel and Collins Rachel S
Bought by
Collins Stephen D
Purchase Details
Closed on
Jan 13, 1998
Sold by
Pierce James and Pierce Sipi
Bought by
Collins Stephen D and Collins Rachel S
Home Financials for this Owner
Home Financials are based on the most recent Mortgage that was taken out on this home.
Original Mortgage
$82,800
Interest Rate
6.95%
Create a Home Valuation Report for This Property
The Home Valuation Report is an in-depth analysis detailing your home's value as well as a comparison with similar homes in the area
Home Values in the Area
Average Home Value in this Area
Purchase History
| Date | Buyer | Sale Price | Title Company |
|---|---|---|---|
| Anderson Robert G | -- | Landmark Title | |
| Collins Stephen D | -- | -- | |
| Collins Stephen D | $103,500 | -- |
Source: Public Records
Mortgage History
| Date | Status | Borrower | Loan Amount |
|---|---|---|---|
| Open | Anderson Robert G | $181,649 | |
| Previous Owner | Collins Stephen D | $82,800 |
Source: Public Records
Tax History Compared to Growth
Tax History
| Year | Tax Paid | Tax Assessment Tax Assessment Total Assessment is a certain percentage of the fair market value that is determined by local assessors to be the total taxable value of land and additions on the property. | Land | Improvement |
|---|---|---|---|---|
| 2024 | $3,598 | $62,230 | $15,230 | $47,000 |
| 2023 | $3,598 | $62,230 | $15,230 | $47,000 |
| 2022 | $3,240 | $42,910 | $10,500 | $32,410 |
| 2021 | $3,390 | $42,910 | $10,500 | $32,410 |
| 2020 | $3,388 | $42,910 | $10,500 | $32,410 |
| 2019 | $3,453 | $39,440 | $10,500 | $28,940 |
| 2018 | $3,462 | $39,440 | $10,500 | $28,940 |
| 2017 | $3,440 | $39,440 | $10,500 | $28,940 |
| 2016 | $3,189 | $37,310 | $10,500 | $26,810 |
| 2015 | $2,930 | $37,310 | $10,500 | $26,810 |
| 2014 | $2,930 | $37,310 | $10,500 | $26,810 |
| 2012 | -- | $35,930 | $9,190 | $26,740 |
Source: Public Records
Map
Nearby Homes
- 6600 Afton Dr
- 4310 Corydale Ct
- 4311 Reeves Ct
- 6781 Taywood Rd
- 3324 Northfield Rd
- 7182 Pugliese Place
- 4250 Willow Creek Dr
- 6624 Stranwood Dr
- 7116 Dominican Dr
- 6885 Garber Rd
- 6505 Taywood Rd
- 7012 Stillmore Dr
- 4507 Skylark Dr
- 5420 Savina Ave
- 164 Copperfield Dr
- 1264 Westbrook Rd
- 173 Copperfield Dr
- 117 Candle Ct Unit 740
- 133 Copperfield Dr
- 174 Candle Ct Unit 12
- 7161 Robert Ulrich Ave
- 7207 Robert Ulrich Ave
- 4032 Rundell Dr
- 4024 Rundell Dr
- 4040 Rundell Dr
- 7141 Robert Ulrich Ave
- 7213 Robert Ulrich Ave
- 7206 Robert Ulrich Ave
- 4016 Rundell Dr
- 4048 Rundell Dr
- 7160 Robert Ulrich Ave
- 7212 Robert Ulrich Ave
- 7121 Robert Ulrich Ave
- 7219 Robert Ulrich Ave
- 7130 Robert Ulrich Ave
- 4008 Rundell Dr
- 4056 Rundell Dr
- 7218 Robert Ulrich Ave
- 4201 Crownwood Ave
- 4033 Rundell Dr