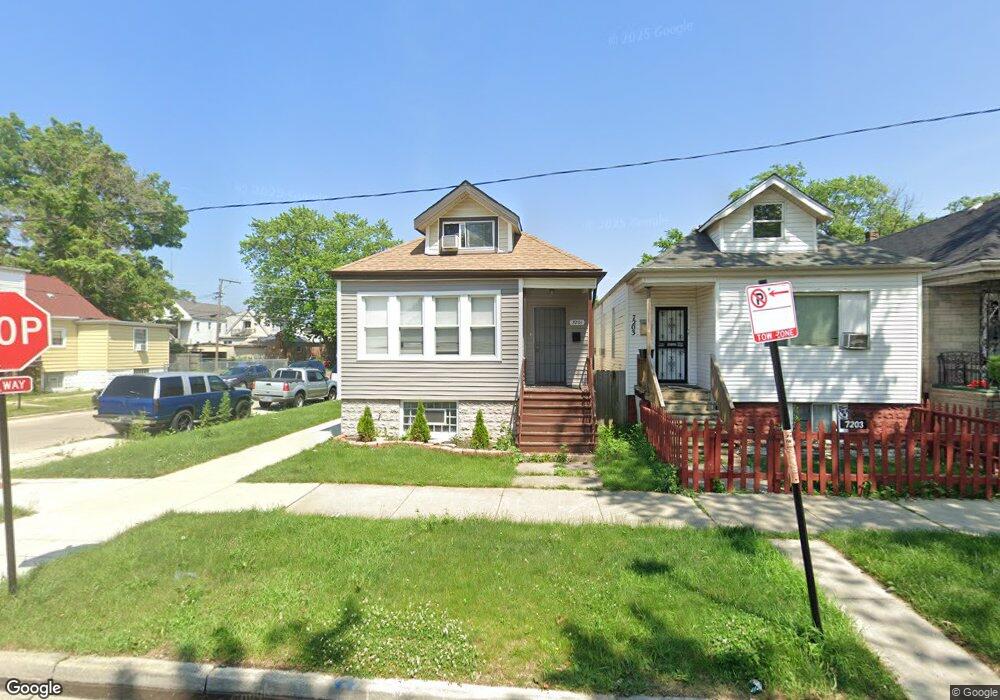
7201 S Hermitage Ave Chicago, IL 60636
Englewood NeighborhoodEstimated Value: $266,000 - $302,000
4
Beds
1
Bath
1,147
Sq Ft
$245/Sq Ft
Est. Value
About This Home
This home is located at 7201 S Hermitage Ave, Chicago, IL 60636 and is currently estimated at $281,559, approximately $245 per square foot. 7201 S Hermitage Ave is a home located in Cook County with nearby schools including Randolph Elementary School and The Montessori School of Englewood Charter School.
Ownership History
Date
Name
Owned For
Owner Type
Purchase Details
Closed on
Feb 18, 2025
Sold by
B W Development Llc
Bought by
Ascencio Ma De Los Angel
Current Estimated Value
Home Financials for this Owner
Home Financials are based on the most recent Mortgage that was taken out on this home.
Original Mortgage
$265,109
Outstanding Balance
$263,739
Interest Rate
7.62%
Mortgage Type
FHA
Estimated Equity
$17,820
Purchase Details
Closed on
Dec 30, 2011
Sold by
Federal National Mortgage Association
Bought by
B W Development Llc
Purchase Details
Closed on
Jun 17, 2011
Sold by
Bentley Jennifer
Bought by
Federal National Mortgage Association
Purchase Details
Closed on
Dec 18, 2007
Sold by
Turner Berta M and Turner Willie
Bought by
Bentley Jennifer
Home Financials for this Owner
Home Financials are based on the most recent Mortgage that was taken out on this home.
Original Mortgage
$153,000
Interest Rate
6.2%
Mortgage Type
Unknown
Create a Home Valuation Report for This Property
The Home Valuation Report is an in-depth analysis detailing your home's value as well as a comparison with similar homes in the area
Home Values in the Area
Average Home Value in this Area
Purchase History
| Date | Buyer | Sale Price | Title Company |
|---|---|---|---|
| Ascencio Ma De Los Angel | $270,000 | Fidelity National Title | |
| B W Development Llc | $9,000 | None Available | |
| Federal National Mortgage Association | -- | None Available | |
| Bentley Jennifer | $170,000 | National Attorneys Title Co |
Source: Public Records
Mortgage History
| Date | Status | Borrower | Loan Amount |
|---|---|---|---|
| Open | Ascencio Ma De Los Angel | $265,109 | |
| Previous Owner | Bentley Jennifer | $153,000 |
Source: Public Records
Tax History Compared to Growth
Tax History
| Year | Tax Paid | Tax Assessment Tax Assessment Total Assessment is a certain percentage of the fair market value that is determined by local assessors to be the total taxable value of land and additions on the property. | Land | Improvement |
|---|---|---|---|---|
| 2024 | $461 | $7,000 | $882 | $6,118 |
| 2023 | $428 | $5,500 | $1,912 | $3,588 |
| 2022 | $428 | $5,500 | $1,912 | $3,588 |
| 2021 | $436 | $5,499 | $1,911 | $3,588 |
| 2020 | $692 | $6,210 | $1,911 | $4,299 |
| 2019 | $697 | $6,901 | $1,911 | $4,990 |
| 2018 | $685 | $6,901 | $1,911 | $4,990 |
| 2017 | $974 | $7,899 | $1,764 | $6,135 |
| 2016 | $1,082 | $7,899 | $1,764 | $6,135 |
| 2015 | $967 | $7,899 | $1,764 | $6,135 |
| 2014 | $916 | $7,503 | $1,617 | $5,886 |
| 2013 | $886 | $7,503 | $1,617 | $5,886 |
Source: Public Records
Map
Nearby Homes
- 7228 S Hermitage Ave
- 7243 S Hermitage Ave
- 7219 S Wood St
- 7225 S Paulina St
- 7244 S Paulina St
- 7149 S Wood St
- 7252 S Wood St
- 7241 S Marshfield Ave
- 7253 S Marshfield Ave
- 7133 S Honore St
- 1809 W 71st St
- 7330 S Wood St
- 1851 W 71st St
- 7056 S Honore St
- 7349 S Honore St
- 1508 W 72nd St
- 7017 S Hermitage Ave
- 7010 S Paulina St
- 7159 S Winchester Ave
- 7015 S Wood St
- 7203 S Hermitage Ave
- 7205 S Hermitage Ave
- 7209 S Hermitage Ave
- 7159 S Hermitage Ave
- 7211 S Hermitage Ave
- 7155 S Hermitage Ave
- 7215 S Hermitage Ave
- 7200 S Paulina St
- 7202 S Paulina St
- 7153 S Hermitage Ave
- 7208 S Paulina St
- 7158 S Paulina St
- 7151 S Hermitage Ave
- 7210 S Paulina St
- 7219 S Hermitage Ave
- 7154 S Paulina St
- 7212 S Paulina St
- 7200 S Hermitage Ave
- 7202 S Hermitage Ave
- 7204 S Hermitage Ave