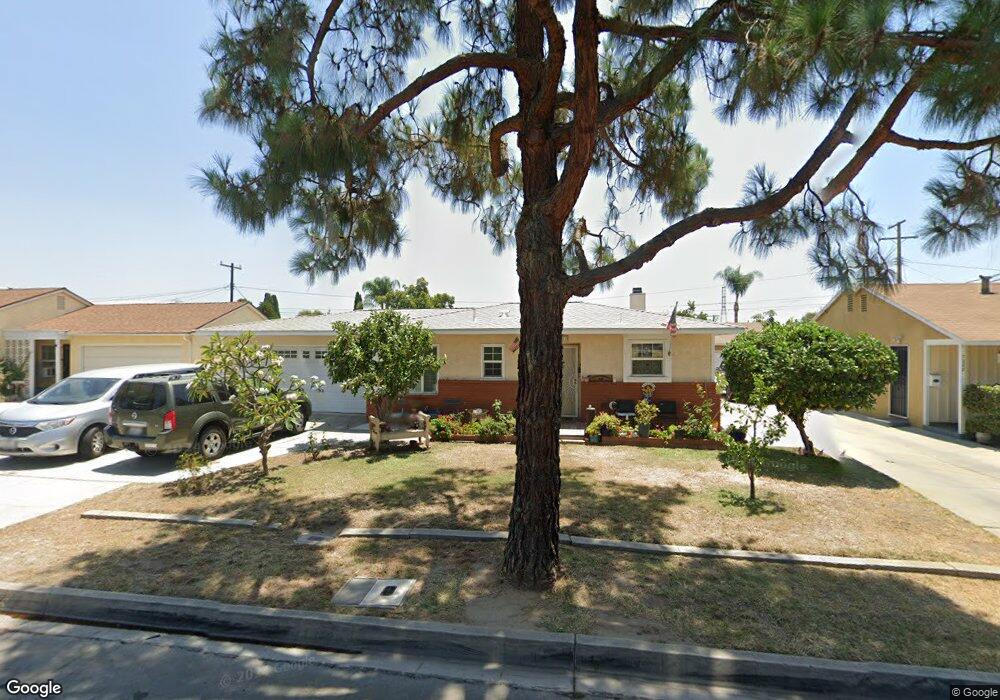
7202 Bennington Ave Pico Rivera, CA 90660
Estimated Value: $732,000 - $826,518
2
Beds
2
Baths
1,758
Sq Ft
$439/Sq Ft
Est. Value
About This Home
This home is located at 7202 Bennington Ave, Pico Rivera, CA 90660 and is currently estimated at $771,380, approximately $438 per square foot. 7202 Bennington Ave is a home located in Los Angeles County with nearby schools including Rivera Elementary School, El Rancho High School, and Ruben Salazar Continuation School.
Ownership History
Date
Name
Owned For
Owner Type
Purchase Details
Closed on
Nov 12, 2004
Sold by
Carrasco Joshua E
Bought by
Carrasco Joshua Eli and Carrasco Olivia Ortega
Current Estimated Value
Home Financials for this Owner
Home Financials are based on the most recent Mortgage that was taken out on this home.
Original Mortgage
$319,500
Outstanding Balance
$161,667
Interest Rate
5.99%
Mortgage Type
New Conventional
Estimated Equity
$609,713
Purchase Details
Closed on
May 23, 2003
Sold by
Darke Janet Netta Glass
Bought by
Carrasco Joshua E and Carrasco Olivia
Home Financials for this Owner
Home Financials are based on the most recent Mortgage that was taken out on this home.
Original Mortgage
$245,700
Interest Rate
5.15%
Mortgage Type
Purchase Money Mortgage
Purchase Details
Closed on
Feb 23, 1999
Sold by
Beattie Annie
Bought by
Beattie Annie and Annie Beattie Trust
Create a Home Valuation Report for This Property
The Home Valuation Report is an in-depth analysis detailing your home's value as well as a comparison with similar homes in the area
Home Values in the Area
Average Home Value in this Area
Purchase History
| Date | Buyer | Sale Price | Title Company |
|---|---|---|---|
| Carrasco Joshua Eli | -- | Investors Title Company | |
| Carrasco Joshua E | $273,000 | Ticor Title Company | |
| Beattie Annie | -- | -- |
Source: Public Records
Mortgage History
| Date | Status | Borrower | Loan Amount |
|---|---|---|---|
| Open | Carrasco Joshua Eli | $319,500 | |
| Previous Owner | Carrasco Joshua E | $245,700 |
Source: Public Records
Tax History
| Year | Tax Paid | Tax Assessment Tax Assessment Total Assessment is a certain percentage of the fair market value that is determined by local assessors to be the total taxable value of land and additions on the property. | Land | Improvement |
|---|---|---|---|---|
| 2025 | $5,647 | $388,128 | $270,986 | $117,142 |
| 2024 | $5,647 | $380,519 | $265,673 | $114,846 |
| 2023 | $7,734 | $373,059 | $260,464 | $112,595 |
| 2022 | $7,491 | $365,745 | $255,357 | $110,388 |
| 2021 | $7,365 | $358,574 | $250,350 | $108,224 |
| 2020 | $7,425 | $354,898 | $247,783 | $107,115 |
| 2019 | $5,096 | $347,940 | $242,925 | $105,015 |
| 2018 | $4,817 | $341,118 | $238,162 | $102,956 |
| 2016 | $4,345 | $327,874 | $228,915 | $98,959 |
| 2015 | $4,280 | $322,950 | $225,477 | $97,473 |
| 2014 | $4,228 | $316,625 | $221,061 | $95,564 |
Source: Public Records
Map
Nearby Homes
- 7128 Farmland Ave
- 9522 Bascom St
- 9346 Canford St
- 7686 Sunflower Dr
- 7679 Sunflower Dr
- 7705 Sage Dr
- 7021 Passons Blvd
- 7019 Passons Blvd
- 7840 Pioneer Blvd
- 7808 Pioneer Blvd
- 9213 Call St
- 9273 Sierra Vista Cir
- 7422 Bequette Ave
- 9515 Shade Ln
- 10934 Choisser St
- 7406 Norwalk Blvd
- 10704 Balfour St
- 6651 Via Vista
- 6650 Via Vista
- 6630 Via Vista
- 7208 Bennington Ave
- 7144 Bennington Ave
- 7149 Farmland Ave
- 7203 Farmland Ave
- 7214 Bennington Ave
- 7138 Bennington Ave
- 7145 Farmland Ave
- 7207 Farmland Ave
- 9662 Abbotsford Rd
- 7139 Farmland Ave
- 7213 Farmland Ave
- 7132 Bennington Ave
- 7220 Bennington Ave
- 9663 Abbotsford Rd
- 9663 Foxbury Way
- 7135 Farmland Ave
- 7217 Farmland Ave
- 9656 Abbotsford Rd
- 9657 Abbotsford Rd
- 7126 Bennington Ave
Your Personal Tour Guide
Ask me questions while you tour the home.