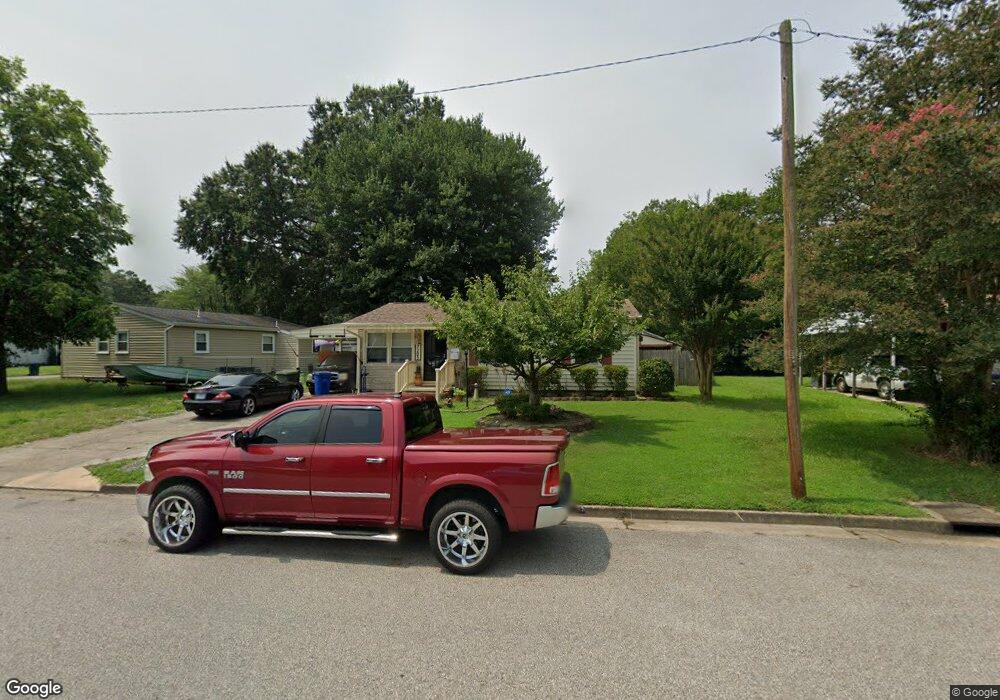
7203 Wickham Ave Newport News, VA 23605
Newmarket Creek NeighborhoodEstimated Value: $256,000 - $273,363
3
Beds
2
Baths
1,460
Sq Ft
$182/Sq Ft
Est. Value
About This Home
This home is located at 7203 Wickham Ave, Newport News, VA 23605 and is currently estimated at $265,591, approximately $181 per square foot. 7203 Wickham Ave is a home located in Newport News City with nearby schools including Carver Elementary School, Crittenden Middle School, and Heritage High School.
Ownership History
Date
Name
Owned For
Owner Type
Purchase Details
Closed on
Oct 24, 2022
Sold by
Warner Carolyn T
Bought by
Green Keesha and Green Tanedra
Current Estimated Value
Home Financials for this Owner
Home Financials are based on the most recent Mortgage that was taken out on this home.
Original Mortgage
$201,286
Outstanding Balance
$194,625
Interest Rate
6.94%
Mortgage Type
FHA
Estimated Equity
$70,966
Create a Home Valuation Report for This Property
The Home Valuation Report is an in-depth analysis detailing your home's value as well as a comparison with similar homes in the area
Home Values in the Area
Average Home Value in this Area
Purchase History
| Date | Buyer | Sale Price | Title Company |
|---|---|---|---|
| Green Keesha | $200,000 | -- |
Source: Public Records
Mortgage History
| Date | Status | Borrower | Loan Amount |
|---|---|---|---|
| Open | Green Keesha | $201,286 | |
| Closed | Green Keesha | $10,250 |
Source: Public Records
Tax History Compared to Growth
Tax History
| Year | Tax Paid | Tax Assessment Tax Assessment Total Assessment is a certain percentage of the fair market value that is determined by local assessors to be the total taxable value of land and additions on the property. | Land | Improvement |
|---|---|---|---|---|
| 2025 | $2,944 | $244,300 | $55,700 | $188,600 |
| 2024 | $2,797 | $237,000 | $48,400 | $188,600 |
| 2023 | $2,726 | $218,600 | $44,000 | $174,600 |
| 2022 | $2,501 | $196,200 | $44,000 | $152,200 |
| 2021 | $1,995 | $163,500 | $40,000 | $123,500 |
| 2020 | $1,990 | $151,100 | $40,000 | $111,100 |
| 2019 | $1,862 | $141,000 | $40,000 | $101,000 |
| 2018 | $1,801 | $136,200 | $40,000 | $96,200 |
| 2017 | $1,801 | $136,200 | $40,000 | $96,200 |
| 2016 | $1,797 | $136,200 | $40,000 | $96,200 |
| 2015 | $1,791 | $136,200 | $40,000 | $96,200 |
| 2014 | $1,714 | $136,200 | $40,000 | $96,200 |
Source: Public Records
Map
Nearby Homes