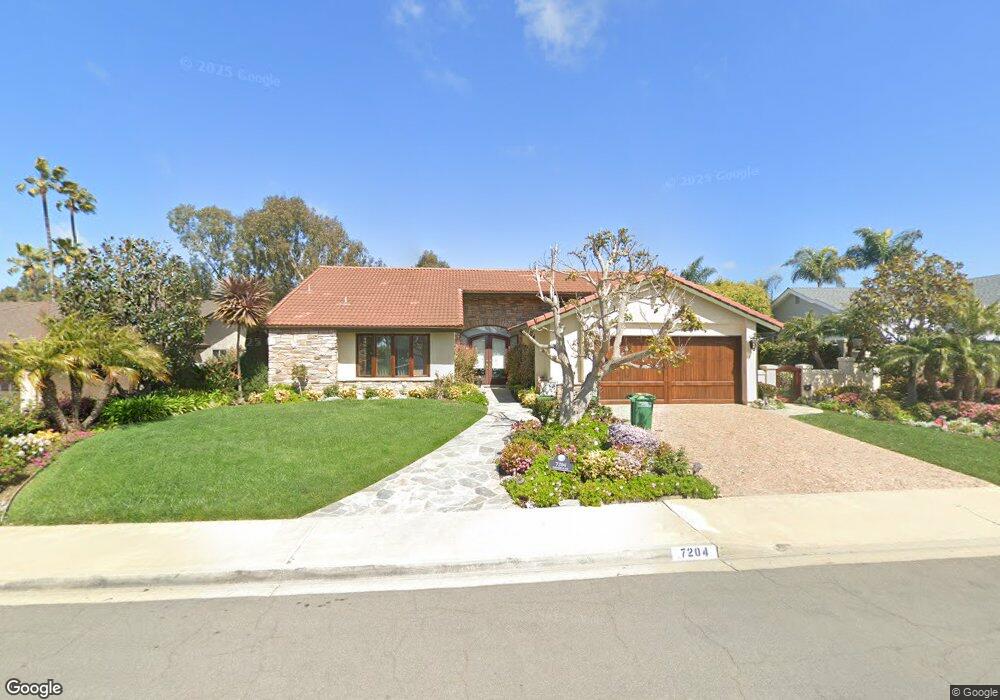
7204 Daffodil Place Carlsbad, CA 92011
Poinsettia NeighborhoodEstimated Value: $1,506,349 - $1,674,000
3
Beds
2
Baths
1,766
Sq Ft
$901/Sq Ft
Est. Value
About This Home
This home is located at 7204 Daffodil Place, Carlsbad, CA 92011 and is currently estimated at $1,590,337, approximately $900 per square foot. 7204 Daffodil Place is a home located in San Diego County with nearby schools including Aviara Oaks Elementary, Aviara Oaks Middle, and Carlsbad High School.
Ownership History
Date
Name
Owned For
Owner Type
Purchase Details
Closed on
Feb 11, 2015
Sold by
Delancey Rose Marie
Bought by
Delancey Rose Marie
Current Estimated Value
Home Financials for this Owner
Home Financials are based on the most recent Mortgage that was taken out on this home.
Original Mortgage
$137,500
Interest Rate
2.99%
Mortgage Type
New Conventional
Purchase Details
Closed on
May 19, 2009
Sold by
Delancey Rose Marie
Bought by
Delancey Rose Marie
Home Financials for this Owner
Home Financials are based on the most recent Mortgage that was taken out on this home.
Original Mortgage
$153,000
Interest Rate
4.78%
Mortgage Type
New Conventional
Purchase Details
Closed on
Nov 25, 1996
Sold by
Delancey Rose M
Bought by
Delancey Rose Marie
Create a Home Valuation Report for This Property
The Home Valuation Report is an in-depth analysis detailing your home's value as well as a comparison with similar homes in the area
Home Values in the Area
Average Home Value in this Area
Purchase History
| Date | Buyer | Sale Price | Title Company |
|---|---|---|---|
| Delancey Rose Marie | -- | Accommodation | |
| Delancey Rose Marie | -- | Fidelity National Title | |
| Delancey Rose Marie | -- | Accommodation | |
| Delancey Rose Marie | -- | Fidelity National Title Co | |
| Delancey Rose Marie | -- | Old Republic Title Company |
Source: Public Records
Mortgage History
| Date | Status | Borrower | Loan Amount |
|---|---|---|---|
| Closed | Delancey Rose Marie | $137,500 | |
| Closed | Delancey Rose Marie | $153,000 |
Source: Public Records
Tax History Compared to Growth
Tax History
| Year | Tax Paid | Tax Assessment Tax Assessment Total Assessment is a certain percentage of the fair market value that is determined by local assessors to be the total taxable value of land and additions on the property. | Land | Improvement |
|---|---|---|---|---|
| 2025 | $3,442 | $327,514 | $120,194 | $207,320 |
| 2024 | $3,442 | $321,093 | $117,838 | $203,255 |
| 2023 | $3,423 | $314,798 | $115,528 | $199,270 |
| 2022 | $3,369 | $308,626 | $113,263 | $195,363 |
| 2021 | $3,343 | $302,576 | $111,043 | $191,533 |
| 2020 | $3,320 | $299,475 | $109,905 | $189,570 |
| 2019 | $3,260 | $293,603 | $107,750 | $185,853 |
| 2018 | $3,124 | $287,847 | $105,638 | $182,209 |
| 2017 | $3,072 | $282,204 | $103,567 | $178,637 |
| 2016 | $2,949 | $276,672 | $101,537 | $175,135 |
| 2015 | $2,936 | $272,517 | $100,012 | $172,505 |
| 2014 | $2,887 | $267,179 | $98,053 | $169,126 |
Source: Public Records
Map
Nearby Homes
- 7089 Tatler Rd
- 7124 Aviara Dr Unit D
- 6777 Lonicera St
- 7219 Linden Terrace
- 6915 Pear Tree Dr
- 7013 Lavender Way
- 874 Marigold Ct
- 6709 Lonicera St
- 6497 Wayfinders Ct
- 6951 Quiet Cove Dr
- 6557 Coneflower Dr
- 7025 San Bartolo St Unit 42
- 7207 Santa Barbara St Unit 154
- 7016 San Carlos St Unit 61
- 7002 San Bartolo St Unit 30
- 7205 Santa Barbara St Unit 153
- 7027 San Bartolo St Unit 43
- 7024 San Bartolo St Unit 19
- 7023 San Bartolo St Unit 41
- 7320 San Bartolo St Unit 217
- 7112 Daffodil Place
- 7206 Daffodil Place
- 7110 Daffodil Place
- 7208 Daffodil Place
- 7205 Daffodil Place
- 7207 Daffodil Place
- 7209 Daffodil Place
- 7108 Daffodil Place
- 7111 Daffodil Place
- 7210 Daffodil Place
- 7109 Daffodil Place
- 7211 Daffodil Place
- 1017 Tulip Way
- 7106 Daffodil Place
- 7107 Daffodil Place Unit 3
- 7212 Daffodil Place
- 1014 Tulip Way
- 7090 Rockrose Terrace
- 1032 Iris Ct
- 1029 Iris Ct