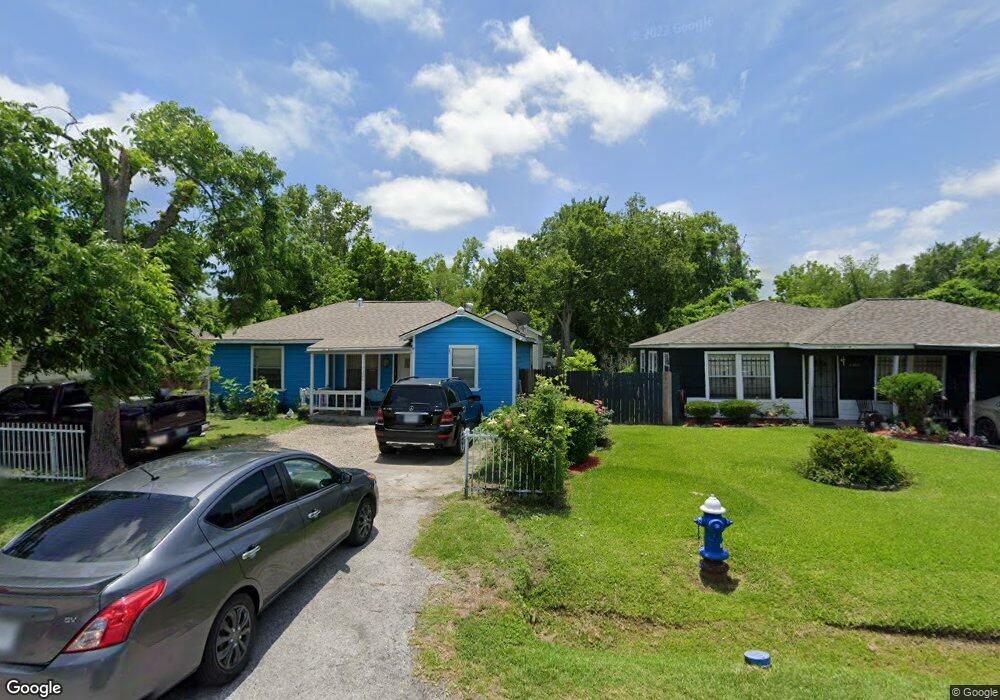
7206 Saint Louis St Houston, TX 77028
Trinity-Houston Gardens NeighborhoodEstimated Value: $155,000 - $173,000
2
Beds
1
Bath
1,090
Sq Ft
$151/Sq Ft
Est. Value
About This Home
This home is located at 7206 Saint Louis St, Houston, TX 77028 and is currently estimated at $164,207, approximately $150 per square foot. 7206 Saint Louis St is a home located in Harris County with nearby schools including McGowen Elementary School, Key Middle, and Kashmere High School.
Ownership History
Date
Name
Owned For
Owner Type
Purchase Details
Closed on
Aug 4, 2017
Sold by
Melbourne Street Llc
Bought by
Casas Edwin Allan Macias and Yanez Agustina Torres
Current Estimated Value
Home Financials for this Owner
Home Financials are based on the most recent Mortgage that was taken out on this home.
Original Mortgage
$60,300
Outstanding Balance
$50,234
Interest Rate
3.9%
Mortgage Type
New Conventional
Estimated Equity
$113,973
Purchase Details
Closed on
Jun 21, 2017
Sold by
Hughes Carolyn Harlan and Hughes Marvin
Bought by
Melbourne Street Llc
Home Financials for this Owner
Home Financials are based on the most recent Mortgage that was taken out on this home.
Original Mortgage
$60,300
Outstanding Balance
$50,234
Interest Rate
3.9%
Mortgage Type
New Conventional
Estimated Equity
$113,973
Purchase Details
Closed on
Oct 18, 2001
Sold by
Harlan Clarence
Bought by
Hughes Carolyn Harlan and Hughes Marvin
Create a Home Valuation Report for This Property
The Home Valuation Report is an in-depth analysis detailing your home's value as well as a comparison with similar homes in the area
Home Values in the Area
Average Home Value in this Area
Purchase History
| Date | Buyer | Sale Price | Title Company |
|---|---|---|---|
| Casas Edwin Allan Macias | -- | None Available | |
| Melbourne Street Llc | -- | None Available | |
| Hughes Carolyn Harlan | -- | -- |
Source: Public Records
Mortgage History
| Date | Status | Borrower | Loan Amount |
|---|---|---|---|
| Open | Casas Edwin Allan Macias | $60,300 |
Source: Public Records
Tax History Compared to Growth
Tax History
| Year | Tax Paid | Tax Assessment Tax Assessment Total Assessment is a certain percentage of the fair market value that is determined by local assessors to be the total taxable value of land and additions on the property. | Land | Improvement |
|---|---|---|---|---|
| 2025 | $3,100 | $134,312 | $49,200 | $85,112 |
| 2024 | $3,100 | $148,169 | $49,200 | $98,969 |
| 2023 | $3,100 | $134,950 | $49,200 | $85,750 |
| 2022 | $2,156 | $97,899 | $26,691 | $71,208 |
| 2021 | $1,815 | $77,890 | $20,972 | $56,918 |
| 2020 | $1,557 | $64,314 | $12,964 | $51,350 |
| 2019 | $1,627 | $64,314 | $12,964 | $51,350 |
| 2018 | $716 | $28,277 | $8,200 | $20,077 |
| 2017 | $937 | $37,066 | $8,200 | $28,866 |
| 2016 | $700 | $27,667 | $5,330 | $22,337 |
| 2015 | $711 | $27,667 | $5,330 | $22,337 |
| 2014 | $711 | $27,667 | $5,330 | $22,337 |
Source: Public Records
Map
Nearby Homes
- 7306 Saint Louis St
- 7337 Howton St
- 7337 Miley St
- 7417 Miley St
- 0 N Wayside Dr Unit 46613359
- 0 N Wayside Dr Unit 98122285
- 0 N Wayside Dr Unit ACT6956085
- 0 Blue St Unit 50257357
- 6920 Homestead Rd
- 5325 Yarmouth
- 0 N Wayside Dr Unit 54910598
- 0 Balfour Unit 51790448
- 7002 Jay St
- 7123 Saint Louis St
- 0 Kellett St Unit 85066707
- 0 Glen Manor Dr Unit 10745202
- 7505 Jay St
- 6942 Peyton St
- 7015 Elbert St
- 7204 Homestead Rd
- 7202 Saint Louis St
- 7210 Saint Louis St
- 7142 Saint Louis St
- 7214 Saint Louis St
- 7205 Howton St
- 7205 Howton St Unit B
- 7213 Howton St
- 7138 Saint Louis St
- 7222 Saint Louis St
- 7141 Howton St
- 7217 Howton St
- 7205 Saint Louis St
- 7145 Saint Louis St
- 7221 Howton St
- 7137 Howton St
- 7134 Saint Louis St
- 7141 Saint Louis St
- 7226 Saint Louis St
- 7137 Saint Louis St
- 7225 Howton St