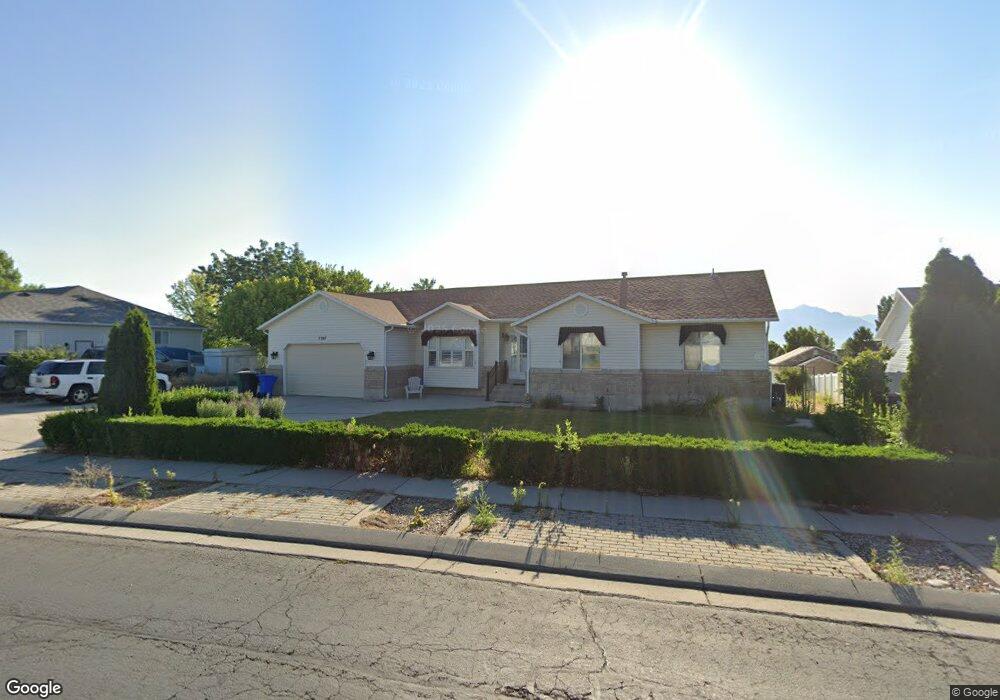
7207 Tico Dr West Jordan, UT 84081
Shadow Mountain NeighborhoodEstimated Value: $699,000 - $800,000
3
Beds
4
Baths
1,807
Sq Ft
$406/Sq Ft
Est. Value
About This Home
This home is located at 7207 Tico Dr, West Jordan, UT 84081 and is currently estimated at $734,187, approximately $406 per square foot. 7207 Tico Dr is a home located in Salt Lake County with nearby schools including Mountain Shadows School, West Hills Middle School, and Copper Hills High School.
Ownership History
Date
Name
Owned For
Owner Type
Purchase Details
Closed on
May 21, 2010
Sold by
Linford Dallas Lemmon and Linford Linda Jean
Bought by
Linford Dallas L and Linford Linda J
Current Estimated Value
Purchase Details
Closed on
Nov 20, 1997
Sold by
Ward Arlo and Ward Emilia
Bought by
Linford Dallas Lemmon and Linford Linda Jean
Home Financials for this Owner
Home Financials are based on the most recent Mortgage that was taken out on this home.
Original Mortgage
$130,000
Outstanding Balance
$21,241
Interest Rate
7.23%
Estimated Equity
$712,946
Purchase Details
Closed on
Jun 4, 1997
Sold by
Ward Arlo
Bought by
Ward Arlo and Ward Emilia
Home Financials for this Owner
Home Financials are based on the most recent Mortgage that was taken out on this home.
Original Mortgage
$113,000
Interest Rate
8.08%
Purchase Details
Closed on
Apr 1, 1997
Sold by
Bowler Realty Inc
Bought by
Ward Arlo
Create a Home Valuation Report for This Property
The Home Valuation Report is an in-depth analysis detailing your home's value as well as a comparison with similar homes in the area
Home Values in the Area
Average Home Value in this Area
Purchase History
| Date | Buyer | Sale Price | Title Company |
|---|---|---|---|
| Linford Dallas L | -- | None Available | |
| Linford Dallas Lemmon | -- | -- | |
| Ward Arlo | -- | -- | |
| Ward Arlo | -- | -- |
Source: Public Records
Mortgage History
| Date | Status | Borrower | Loan Amount |
|---|---|---|---|
| Open | Linford Dallas Lemmon | $130,000 | |
| Previous Owner | Ward Arlo | $113,000 |
Source: Public Records
Tax History Compared to Growth
Tax History
| Year | Tax Paid | Tax Assessment Tax Assessment Total Assessment is a certain percentage of the fair market value that is determined by local assessors to be the total taxable value of land and additions on the property. | Land | Improvement |
|---|---|---|---|---|
| 2025 | $3,718 | $724,900 | $215,400 | $509,500 |
| 2024 | $3,718 | $715,300 | $207,100 | $508,200 |
| 2023 | $3,442 | $624,200 | $199,100 | $425,100 |
| 2022 | $3,602 | $642,500 | $195,300 | $447,200 |
| 2021 | $3,199 | $519,500 | $150,200 | $369,300 |
| 2020 | $3,026 | $461,200 | $138,100 | $323,100 |
| 2019 | $3,019 | $451,200 | $130,300 | $320,900 |
| 2018 | $2,780 | $412,100 | $130,300 | $281,800 |
| 2017 | $2,588 | $381,900 | $130,300 | $251,600 |
| 2016 | $2,379 | $329,900 | $136,900 | $193,000 |
| 2015 | $2,440 | $329,900 | $146,600 | $183,300 |
| 2014 | $2,305 | $306,800 | $141,900 | $164,900 |
Source: Public Records
Map
Nearby Homes
- 5208 W Case Mountain Rd
- 7043 Orion Hill Rd
- 7288 Comet Hill Cir
- 7043 S Orion Hill Rd
- 5151 Case Mountain Rd
- 7246 W Terraine Rd
- 7238 W Terraine Rd
- 7232 W Terraine Rd
- 7414 Regal Hill Dr
- 7563 S Opal Mountain Way W Unit 306
- 7567 S Opal Mountain Way W Unit 307
- 7556 S Opal Mountain Way W Unit 311
- 7569 S Opal Mountain Way W Unit 308
- 7554 S Opal Mountain Way W Unit 310
- 7553 S Opal Mountain Way W Unit 302
- 7758 S Iron Core Ln
- 7146 W Owens View Way Unit 204
- 7259 W Cibola Rd
- 6880 S Survey Peak Ln
- 6884 S Survey Peak Ln
- 7193 Tico Dr
- 7223 Tico Dr
- 7216 Tico Dr
- 5308 Cygnus Hill Cove
- 5308 W Cygnus Hill Cove
- 7177 Tico Dr
- 7237 Tico Dr
- 7202 Tico Dr
- 5311 Cygnus Hill Cove
- 7232 Tico Dr
- 7232 S Tico Dr
- 5339 Case Mountain Rd
- 7253 S Tico Dr
- 7253 Tico Dr
- 7182 Tico Dr
- 5339 W Case Mountain Rd
- 5323 W Case Mountain Rd
- 5323 Case Mountain Rd
- 7157 Tico Dr
- 7248 Tico Dr