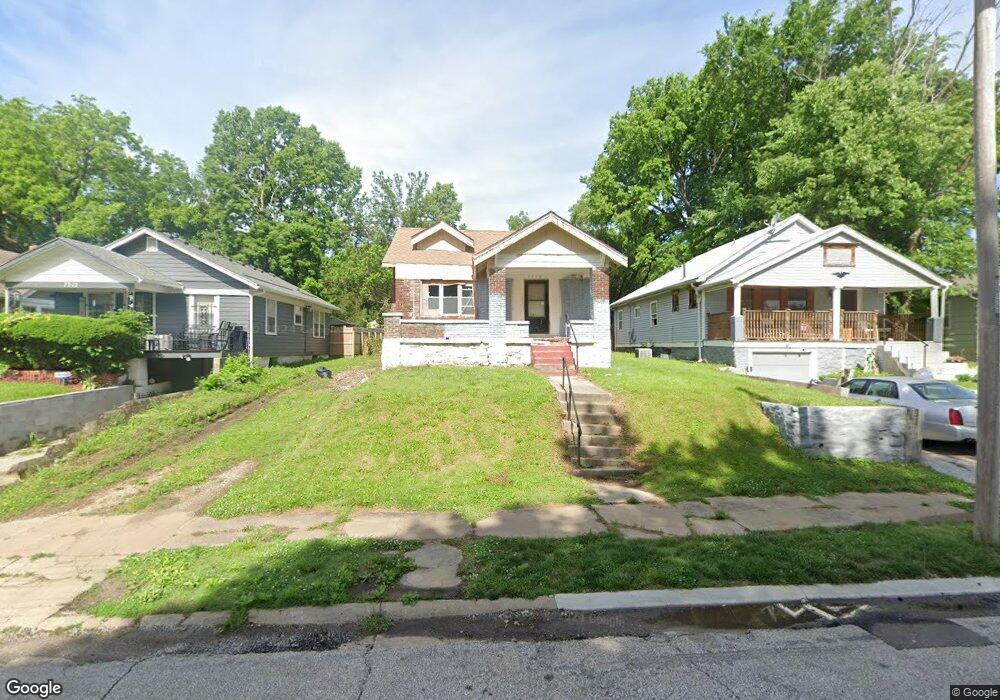
7208 Agnes Ave Kansas City, MO 64132
Noble And Gregory Ridge NeighborhoodEstimated Value: $96,952 - $161,000
4
Beds
2
Baths
984
Sq Ft
$131/Sq Ft
Est. Value
About This Home
This home is located at 7208 Agnes Ave, Kansas City, MO 64132 and is currently estimated at $128,738, approximately $130 per square foot. 7208 Agnes Ave is a home located in Jackson County with nearby schools including Benjamin Banneker Elementary School, Central Middle School, and Southeast High School.
Ownership History
Date
Name
Owned For
Owner Type
Purchase Details
Closed on
Feb 9, 2022
Sold by
Given Not
Bought by
Dream Homes Llc
Current Estimated Value
Purchase Details
Closed on
Mar 24, 2009
Sold by
The Bank Of New York Mellon
Bought by
Crn Management Llc
Purchase Details
Closed on
Dec 28, 2007
Sold by
Canady Christophe and Canady Monica
Bought by
The Bank Of New York and Equity One Inc Mortgage/Pass Through Cer
Purchase Details
Closed on
Feb 22, 2001
Sold by
Philcorp Capital Inc
Bought by
Canady Christopher and Canady Monica
Home Financials for this Owner
Home Financials are based on the most recent Mortgage that was taken out on this home.
Original Mortgage
$54,400
Interest Rate
6.58%
Mortgage Type
Balloon
Purchase Details
Closed on
Feb 27, 1998
Sold by
Harding Donald A and Harding Delores A
Bought by
Philcorp Capital Inc
Create a Home Valuation Report for This Property
The Home Valuation Report is an in-depth analysis detailing your home's value as well as a comparison with similar homes in the area
Home Values in the Area
Average Home Value in this Area
Purchase History
| Date | Buyer | Sale Price | Title Company |
|---|---|---|---|
| Dream Homes Llc | -- | None Listed On Document | |
| Dream Homes Llc | -- | None Listed On Document | |
| Crn Management Llc | -- | Mokan Title Services Llc | |
| The Bank Of New York | $45,500 | None Available | |
| Canady Christopher | -- | Security Land Title Company | |
| Philcorp Capital Inc | -- | -- |
Source: Public Records
Mortgage History
| Date | Status | Borrower | Loan Amount |
|---|---|---|---|
| Previous Owner | Canady Christopher | $54,400 |
Source: Public Records
Tax History Compared to Growth
Tax History
| Year | Tax Paid | Tax Assessment Tax Assessment Total Assessment is a certain percentage of the fair market value that is determined by local assessors to be the total taxable value of land and additions on the property. | Land | Improvement |
|---|---|---|---|---|
| 2025 | $720 | $6,282 | $2,670 | $3,612 |
| 2024 | $713 | $9,122 | $1,207 | $7,915 |
| 2023 | $713 | $9,122 | $595 | $8,527 |
| 2022 | $391 | $4,750 | $1,539 | $3,211 |
| 2021 | $389 | $4,750 | $1,539 | $3,211 |
| 2020 | $394 | $4,750 | $1,539 | $3,211 |
| 2019 | $697 | $4,750 | $1,539 | $3,211 |
| 2018 | $334 | $4,200 | $819 | $3,381 |
| 2017 | $334 | $4,200 | $819 | $3,381 |
| 2016 | $328 | $4,094 | $603 | $3,491 |
| 2014 | $329 | $4,094 | $603 | $3,491 |
Source: Public Records
Map
Nearby Homes
- 3913 E 73rd St
- 7119 Bellefontaine Ave
- 7103 Agnes Ave
- 7115 Bellefontaine Ave
- 7040 Agnes Ave
- 7325 Walrond Ave
- 7216 Indiana Ave
- 7012 S Benton Ave
- 7013 Bellefontaine Ave
- 6947 Bellefontaine Ave
- 2650 NE 74th Terrace
- 7015 College Ave
- 6933 Walrond Ave
- 6942 College Ave
- 2422 E 70th Terrace
- 7426 Indiana Ave
- 7233 Park Ave
- 2216 E 73rd St
- 6823 S Benton Ave
- 3500 E 75th St
- 7212 Agnes Ave
- 7216 Agnes Ave
- 2925 E 72nd St
- 7209 Agnes Ave
- 7205 Agnes Ave
- 7217 Agnes Ave
- 7218 Agnes Ave
- 7215 S Benton Ave
- 7221 Agnes Ave
- 7201 Agnes Ave
- 7201 S Benton Ave
- 7223 Agnes Ave
- 7146 Agnes Ave
- 7205 S Benton Ave
- 7226 Agnes Ave
- 7211 S Benton Ave
- 7225 Agnes Ave
- 3000 E 72nd St
- 7217 S Benton Ave
- 7144 Agnes Ave