


7209 E Chestnut St Evansville, IN 47715
Plaza Park NeighborhoodEstimated payment $2,689/month
Total Views
75
5
Beds
2.5
Baths
4,058
Sq Ft
$108
Price per Sq Ft
Highlights
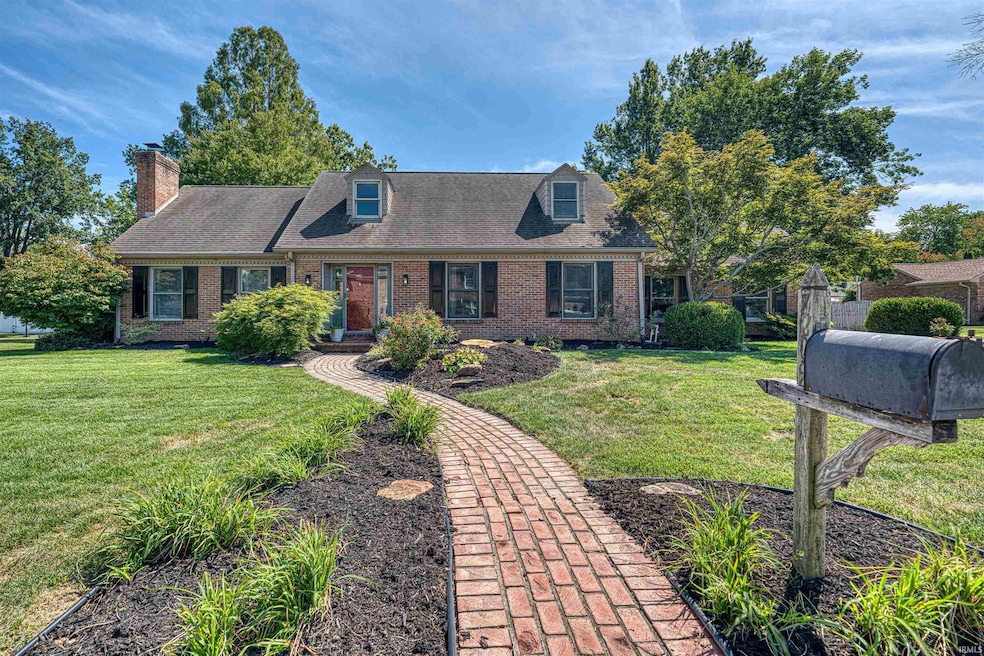
- Cape Cod Architecture
- Stone Countertops
- Community Fire Pit
- Wood Flooring
- Covered Patio or Porch
- 2 Car Attached Garage
About This Home
Situated in a prime eastside location, this spacious home has traditional features with modern updates. The updated kitchen includes all appliances and opens to the family room. The primary suite is on the main level. Upstairs are four additional bedrooms. All bathrooms have been updated. The basement has a large living room plus a utility area with the laundry. Outside, the backyard is highlighted with its terrific pool, firepit area and large covered patio. Seller is providing an AHS Home Warranty ($800).
Listing Agent
ERA FIRST ADVANTAGE REALTY, INC Brokerage Phone: 812-858-2400 Listed on: 08/27/2025
Home Details
Home Type
- Single Family
Est. Annual Taxes
- $3,738
Year Built
- Built in 1970
Lot Details
- 0.35 Acre Lot
- Lot Dimensions are 127x120
- Privacy Fence
- Wood Fence
- Landscaped
- Level Lot
Parking
- 2 Car Attached Garage
- Garage Door Opener
- Driveway
Home Design
- Cape Cod Architecture
- Traditional Architecture
- Brick Exterior Construction
- Shingle Roof
Interior Spaces
- 2-Story Property
- Built-in Bookshelves
- Ceiling Fan
- Entrance Foyer
- Living Room with Fireplace
- Basement
- Crawl Space
Kitchen
- Eat-In Kitchen
- Breakfast Bar
- Stone Countertops
- Disposal
Flooring
- Wood
- Carpet
- Tile
Bedrooms and Bathrooms
- 5 Bedrooms
- Walk-In Closet
- Double Vanity
- Separate Shower
Schools
- Hebron Elementary School
- Plaza Park Middle School
- William Henry Harrison High School
Utilities
- Forced Air Heating and Cooling System
- Heating System Uses Gas
Additional Features
- Covered Patio or Porch
- Suburban Location
Community Details
- Carrollton Court Subdivision
- Community Fire Pit
Listing and Financial Details
- Home warranty included in the sale of the property
- Assessor Parcel Number 82-07-30-011-185.003-027
Map
Create a Home Valuation Report for This Property
The Home Valuation Report is an in-depth analysis detailing your home's value as well as a comparison with similar homes in the area
Home Values in the Area
Average Home Value in this Area
Tax History
| Year | Tax Paid | Tax Assessment Tax Assessment Total Assessment is a certain percentage of the fair market value that is determined by local assessors to be the total taxable value of land and additions on the property. | Land | Improvement |
|---|---|---|---|---|
| 2024 | $3,738 | $344,500 | $41,000 | $303,500 |
| 2023 | $4,239 | $378,600 | $45,100 | $333,500 |
| 2022 | $3,475 | $313,000 | $45,100 | $267,900 |
| 2021 | $3,100 | $277,200 | $45,100 | $232,100 |
| 2020 | $3,089 | $275,300 | $45,100 | $230,200 |
| 2019 | $3,069 | $275,300 | $45,100 | $230,200 |
| 2018 | $3,159 | $276,200 | $45,100 | $231,100 |
| 2017 | $3,167 | $273,900 | $45,100 | $228,800 |
| 2016 | $2,981 | $256,800 | $45,100 | $211,700 |
| 2014 | $3,078 | $265,400 | $45,100 | $220,300 |
| 2013 | -- | $244,300 | $45,100 | $199,200 |
Source: Public Records
Property History
| Date | Event | Price | Change | Sq Ft Price |
|---|---|---|---|---|
| 08/28/2025 08/28/25 | Pending | -- | -- | -- |
| 08/27/2025 08/27/25 | For Sale | $439,900 | -- | $108 / Sq Ft |
Source: Indiana Regional MLS
Purchase History
| Date | Type | Sale Price | Title Company |
|---|---|---|---|
| Interfamily Deed Transfer | -- | None Available | |
| Deed | $260,000 | -- | |
| Warranty Deed | -- | None Available |
Source: Public Records
Mortgage History
| Date | Status | Loan Amount | Loan Type |
|---|---|---|---|
| Open | $294,000 | New Conventional | |
| Closed | $75,000 | Construction | |
| Closed | $28,500 | Credit Line Revolving | |
| Closed | $6,000 | New Conventional | |
| Closed | $246,000 | New Conventional | |
| Previous Owner | $236,472 | FHA | |
| Previous Owner | $239,580 | FHA | |
| Previous Owner | $195,470 | Future Advance Clause Open End Mortgage |
Source: Public Records
Similar Homes in Evansville, IN
Source: Indiana Regional MLS
MLS Number: 202534747
APN: 82-07-30-011-185.003-027
Disclaimer: Certain information contained herein is derived from information provided by parties other than Homes.com. All information provided is deemed reliable, but is not guaranteed to be accurate and should be independently verified.
![]() IDX information is provided exclusively for personal, non-commercial use, and may not be used for any purpose other than to identify prospective properties consumers may be interested in purchasing. Information is deemed reliable but not guaranteed.
IDX information is provided exclusively for personal, non-commercial use, and may not be used for any purpose other than to identify prospective properties consumers may be interested in purchasing. Information is deemed reliable but not guaranteed.
Nearby Homes
- 501 Oriole Dr
- 509 Martin Ln
- 7416 E Sycamore St
- 229 Plaza Dr
- 6808 Lincoln Ave
- 6616 E Chestnut St
- 6701 E Oak St
- 7224 E Gum St
- 6600 E Chestnut St
- 6510 Lincoln Ave
- 720 Southfield Rd
- 6412 E Oak St
- 6405 Highcroft Dr
- 867 Park Plaza Dr
- 7121 E Powell Ave
- 6702 Newburgh Rd
- 6718 Newburgh Rd
- 7861 Brookridge Ct
- 6509 Newburgh Rd
- 618 Kingswood Dr