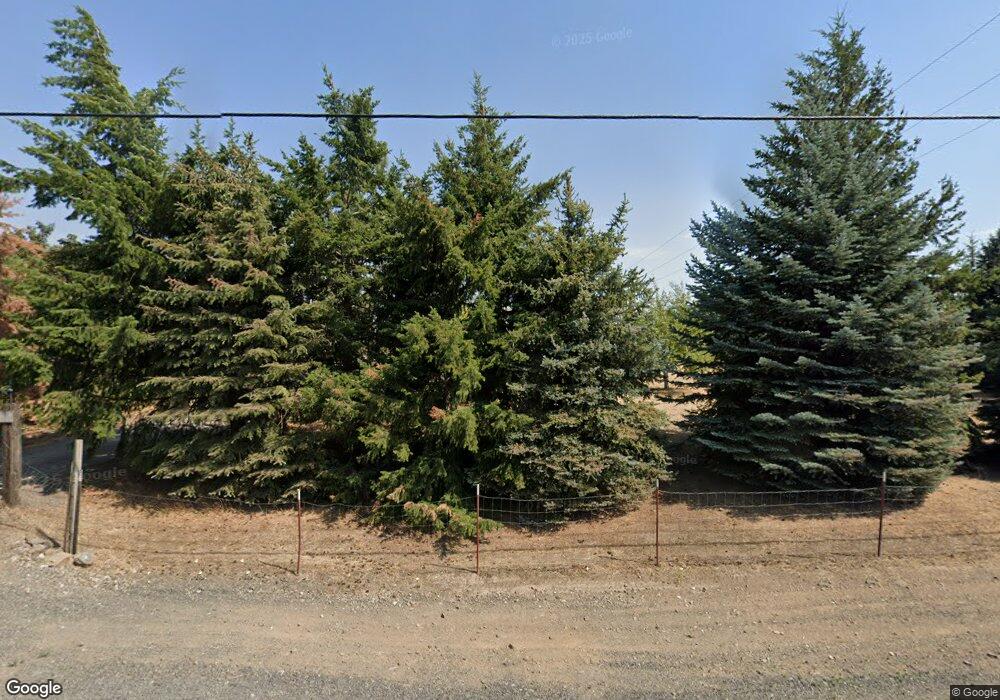
7209 S Craig Rd Cheney, WA 99004
Estimated Value: $438,238 - $662,000
3
Beds
2
Baths
2,943
Sq Ft
$185/Sq Ft
Est. Value
About This Home
This home is located at 7209 S Craig Rd, Cheney, WA 99004 and is currently estimated at $544,060, approximately $184 per square foot. 7209 S Craig Rd is a home located in Spokane County with nearby schools including Betz Elementary School, Cheney Middle School, and Cheney High School.
Ownership History
Date
Name
Owned For
Owner Type
Purchase Details
Closed on
Aug 25, 1998
Sold by
Ft Mortgage
Bought by
Scott Paul J and Scott Georgeanne D
Current Estimated Value
Home Financials for this Owner
Home Financials are based on the most recent Mortgage that was taken out on this home.
Original Mortgage
$119,213
Interest Rate
6.91%
Purchase Details
Closed on
Apr 24, 1998
Sold by
Countrywide Home Loans Inc
Bought by
Ft Mtg
Purchase Details
Closed on
Mar 9, 1998
Sold by
Eatock H William
Bought by
Countrywide Home Loans Inc
Purchase Details
Closed on
Jan 10, 1997
Sold by
Eatock H William
Bought by
Newscope Investments Ltd Partnership
Purchase Details
Closed on
Feb 16, 1996
Sold by
Rausch Christopher Allen
Bought by
Eatock H William
Home Financials for this Owner
Home Financials are based on the most recent Mortgage that was taken out on this home.
Original Mortgage
$123,500
Interest Rate
5.25%
Create a Home Valuation Report for This Property
The Home Valuation Report is an in-depth analysis detailing your home's value as well as a comparison with similar homes in the area
Home Values in the Area
Average Home Value in this Area
Purchase History
| Date | Buyer | Sale Price | Title Company |
|---|---|---|---|
| Scott Paul J | -- | First American Title Ins | |
| Ft Mtg | -- | First American Title Ins Co | |
| Countrywide Home Loans Inc | $125,000 | First American Title Ins | |
| Newscope Investments Ltd Partnership | -- | -- | |
| Eatock H William | $130,000 | Transnation Title |
Source: Public Records
Mortgage History
| Date | Status | Borrower | Loan Amount |
|---|---|---|---|
| Previous Owner | Scott Paul J | $119,213 | |
| Previous Owner | Eatock H William | $123,500 |
Source: Public Records
Tax History Compared to Growth
Tax History
| Year | Tax Paid | Tax Assessment Tax Assessment Total Assessment is a certain percentage of the fair market value that is determined by local assessors to be the total taxable value of land and additions on the property. | Land | Improvement |
|---|---|---|---|---|
| 2025 | $733 | $488,540 | $117,840 | $370,700 |
| 2024 | $733 | $489,680 | $172,880 | $316,800 |
| 2023 | $3,460 | $414,620 | $72,020 | $342,600 |
| 2022 | $3,558 | $414,620 | $72,020 | $342,600 |
| 2021 | $3,538 | $319,440 | $51,440 | $268,000 |
| 2020 | $3,417 | $295,240 | $51,440 | $243,800 |
| 2019 | $3,053 | $279,540 | $51,440 | $228,100 |
| 2018 | $2,967 | $230,580 | $27,080 | $203,500 |
| 2017 | $2,397 | $207,380 | $27,080 | $180,300 |
| 2016 | $2,429 | $202,060 | $25,960 | $176,100 |
| 2015 | $2,548 | $202,760 | $25,960 | $176,800 |
| 2014 | -- | $202,760 | $25,960 | $176,800 |
| 2013 | -- | $0 | $0 | $0 |
Source: Public Records
Map
Nearby Homes
- 6024 S Craig Rd
- 14809 W Taylor Rd
- 10117 S Electric St
- 10510 W Richland #36 Rd Unit 10510 W Richland Rd
- NKA W 3rd Ave Unit Parcel number 14231.
- 10521 W Salmonberry Rd
- 10314 W Lingonberry Ct
- XX Vacant Land Lot 27 St
- 10910 W 53rd Ave
- 9212 S Silver Lake Rd
- 10515 W Champion Dr
- 10510 W Richland Rd Unit Lot 49
- 10510 W Richland Rd Unit 28
- 10510 W Richland Rd Unit 86
- 10510 W Richland Rd Unit 37
- Cali Plan at Needham Hill
- SIERRA Plan at Needham Hill
- KERRY Plan at Needham Hill
- MAPLE Plan at Needham Hill
- SHERWOOD Plan at Needham Hill
- 7309 S Craig Rd
- 7105 S Craig Rd
- 7208 S Craig Rd
- 7310 S Craig Rd
- 7104 S Craig Rd
- 7407 S Craig Rd
- 6925 S Craig Rd
- 7406 S Craig Rd
- 7010 S Craig Rd
- 7525 S Craig Rd
- 7502 S Craig Rd
- 7106 S Craig Rd
- 6914 S Craig Rd
- 6917 S Craig Rd
- 7608 S Craig Rd
- 7625 S Craig Rd
- 6801 S Craig Rd
- 7714 S Craig Rd
- 13201 W Medical Lake Rd
- 6707 S Craig Rd