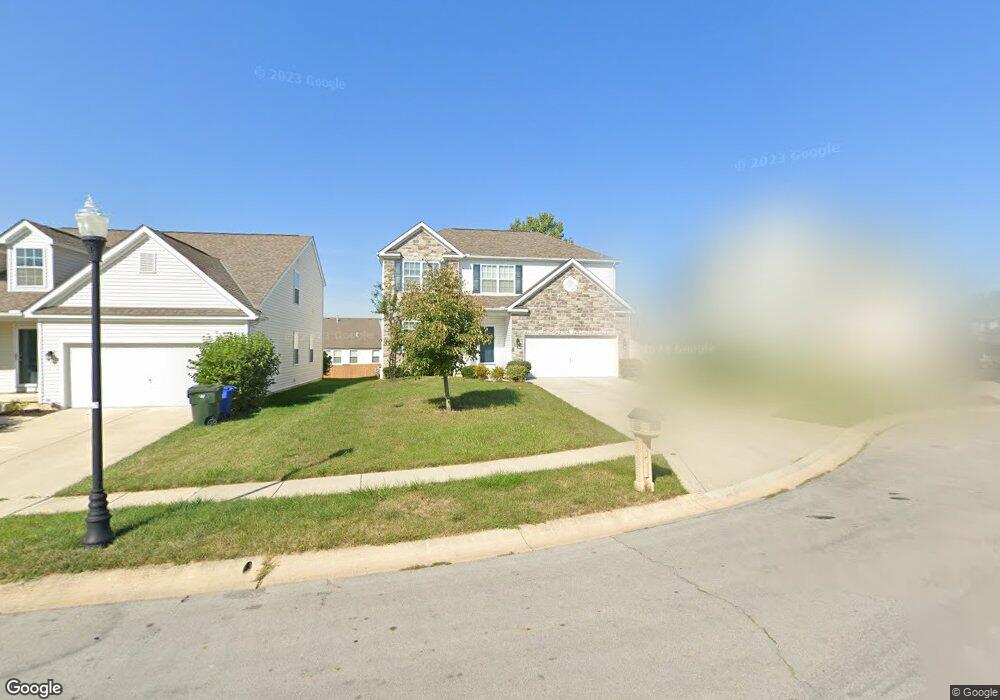
721 Alexia Ct Unit Lot 230 Blacklick, OH 43004
East Broad NeighborhoodEstimated Value: $395,430 - $426,000
3
Beds
2
Baths
1,470
Sq Ft
$284/Sq Ft
Est. Value
About This Home
This home is located at 721 Alexia Ct Unit Lot 230, Blacklick, OH 43004 and is currently estimated at $417,858, approximately $284 per square foot. 721 Alexia Ct Unit Lot 230 is a home located in Franklin County with nearby schools including North Elementary School, Licking Heights Central, and Licking Heights High School.
Ownership History
Date
Name
Owned For
Owner Type
Purchase Details
Closed on
Feb 29, 2012
Sold by
Westport Homes Inc
Bought by
Ward Shari E and Ward Monte L
Current Estimated Value
Home Financials for this Owner
Home Financials are based on the most recent Mortgage that was taken out on this home.
Original Mortgage
$189,324
Outstanding Balance
$131,923
Interest Rate
4.25%
Mortgage Type
FHA
Estimated Equity
$285,935
Purchase Details
Closed on
Oct 20, 2009
Sold by
S & J Real Estate Investment Co Ltd
Bought by
Westport Homes Inc
Home Financials for this Owner
Home Financials are based on the most recent Mortgage that was taken out on this home.
Original Mortgage
$31,000,000
Interest Rate
5.1%
Mortgage Type
Purchase Money Mortgage
Create a Home Valuation Report for This Property
The Home Valuation Report is an in-depth analysis detailing your home's value as well as a comparison with similar homes in the area
Home Values in the Area
Average Home Value in this Area
Purchase History
| Date | Buyer | Sale Price | Title Company |
|---|---|---|---|
| Ward Shari E | $194,300 | Bx Talon Group | |
| Westport Homes Inc | $577,000 | Talon Group |
Source: Public Records
Mortgage History
| Date | Status | Borrower | Loan Amount |
|---|---|---|---|
| Open | Ward Shari E | $189,324 | |
| Previous Owner | Westport Homes Inc | $31,000,000 |
Source: Public Records
Tax History Compared to Growth
Tax History
| Year | Tax Paid | Tax Assessment Tax Assessment Total Assessment is a certain percentage of the fair market value that is determined by local assessors to be the total taxable value of land and additions on the property. | Land | Improvement |
|---|---|---|---|---|
| 2024 | $6,635 | $128,210 | $30,520 | $97,690 |
| 2023 | $6,812 | $128,205 | $30,520 | $97,685 |
| 2022 | $5,210 | $85,120 | $13,650 | $71,470 |
| 2021 | $5,240 | $85,120 | $13,650 | $71,470 |
| 2020 | $5,207 | $85,120 | $13,650 | $71,470 |
| 2019 | $4,682 | $70,850 | $11,380 | $59,470 |
| 2018 | $4,543 | $70,850 | $11,380 | $59,470 |
| 2017 | $4,658 | $70,850 | $11,380 | $59,470 |
| 2016 | $4,453 | $64,060 | $10,190 | $53,870 |
| 2015 | $4,382 | $64,060 | $10,190 | $53,870 |
| 2014 | $4,434 | $64,060 | $10,190 | $53,870 |
| 2013 | $2,207 | $64,050 | $10,185 | $53,865 |
Source: Public Records
Map
Nearby Homes
- 8331 Olympus Ln
- 8340 Crete Ln
- 726 Flowering Cherry Ct
- 8222 Old Ivory Way
- 8492 Haleigh Woods Dr
- 547 Marcum Rd
- 491 Tourmaline Dr
- 496 Tourmaline Dr
- 593 River Pebble Dr
- 8487 Amarillo Dr
- 775 Bent Oak Dr
- 545 River Pebble Dr
- 823 Bent Oak Dr
- 8516 Old Ivory Way
- 1208 Tannic St
- 281 Kestrel Dr
- 7950 Chapel Stone Rd Unit 3A
- 7958 Waggoner Run Dr
- 7714 Solomen Run Dr
- 8350 Hickory Overlook Unit 8350
- 721 Alexia Ct
- 715 Alexia Ct
- 727 Alexia Ct
- 0 Alexia Ct Unit LOT 229
- 744 Solaris Ct
- 738 Solaris Ct
- 733 Alexia Ct
- 733 Alexia Ct Unit Lot 232
- 722 Alexia Ct
- 716 Alexia Ct
- 734 Alexia Ct
- 8313 Olympus Ln
- 8307 Olympus Ln
- 8319 Olympus Ln
- 728 Alexia Ct
- 728 Alexia Ct Unit Lot 234
- 0 Olympus Ln Unit Lot 125 2746214
- 0 Olympus Ln Unit Lot 130
- 8325 Olympus Ln Unit 127
- 8325 Olympus Ln