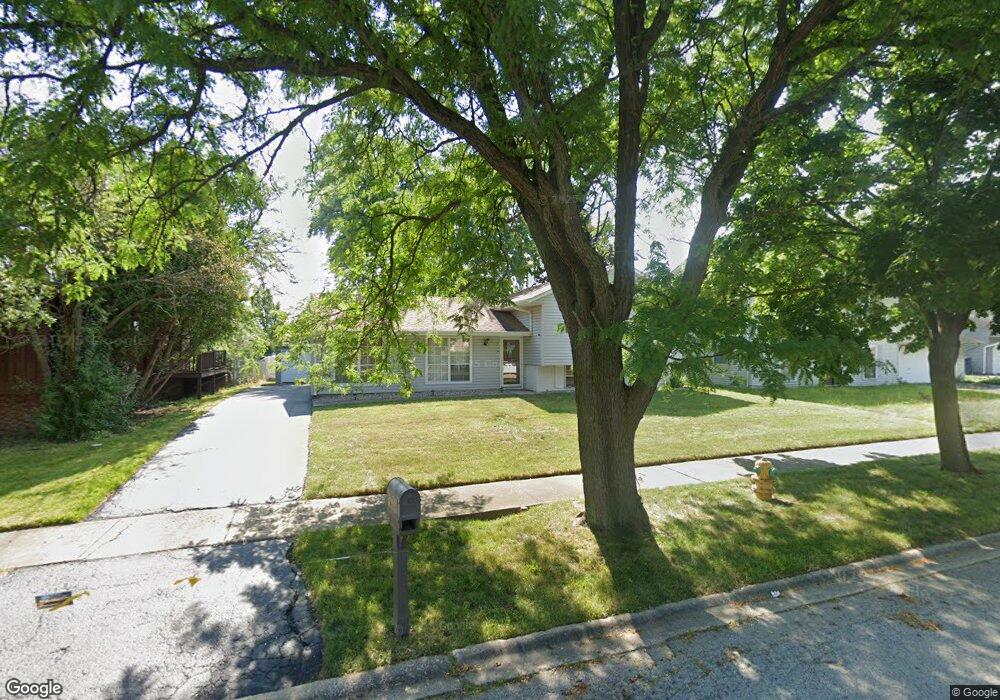
721 Bradley Ave Matteson, IL 60443
West Matteson NeighborhoodEstimated Value: $192,000 - $229,000
3
Beds
2
Baths
1,236
Sq Ft
$169/Sq Ft
Est. Value
About This Home
This home is located at 721 Bradley Ave, Matteson, IL 60443 and is currently estimated at $208,435, approximately $168 per square foot. 721 Bradley Ave is a home located in Cook County with nearby schools including Colin Powell Middle School and Southland College Prep.
Ownership History
Date
Name
Owned For
Owner Type
Purchase Details
Closed on
Feb 22, 2006
Sold by
Gmac Mortgage Corp
Bought by
Rudolph Jessie
Current Estimated Value
Home Financials for this Owner
Home Financials are based on the most recent Mortgage that was taken out on this home.
Original Mortgage
$108,000
Outstanding Balance
$68,497
Interest Rate
8.75%
Mortgage Type
Fannie Mae Freddie Mac
Estimated Equity
$139,938
Purchase Details
Closed on
Feb 17, 2006
Sold by
Graham Darrell
Bought by
Gmac Mortgage Corp
Home Financials for this Owner
Home Financials are based on the most recent Mortgage that was taken out on this home.
Original Mortgage
$108,000
Outstanding Balance
$68,497
Interest Rate
8.75%
Mortgage Type
Fannie Mae Freddie Mac
Estimated Equity
$139,938
Purchase Details
Closed on
Jun 21, 2002
Sold by
Stevens Douglas A and Stevens Barbara
Bought by
Graham Darrell and Mckenzie Graham Tracy
Home Financials for this Owner
Home Financials are based on the most recent Mortgage that was taken out on this home.
Original Mortgage
$124,200
Interest Rate
6.91%
Mortgage Type
FHA
Create a Home Valuation Report for This Property
The Home Valuation Report is an in-depth analysis detailing your home's value as well as a comparison with similar homes in the area
Home Values in the Area
Average Home Value in this Area
Purchase History
| Date | Buyer | Sale Price | Title Company |
|---|---|---|---|
| Rudolph Jessie | $135,000 | First American | |
| Gmac Mortgage Corp | -- | First American | |
| Graham Darrell | $126,000 | -- |
Source: Public Records
Mortgage History
| Date | Status | Borrower | Loan Amount |
|---|---|---|---|
| Open | Rudolph Jessie | $108,000 | |
| Previous Owner | Graham Darrell | $124,200 | |
| Closed | Graham Darrell | $4,968 |
Source: Public Records
Tax History
| Year | Tax Paid | Tax Assessment Tax Assessment Total Assessment is a certain percentage of the fair market value that is determined by local assessors to be the total taxable value of land and additions on the property. | Land | Improvement |
|---|---|---|---|---|
| 2025 | $4,988 | $18,000 | $3,360 | $14,640 |
| 2024 | $4,988 | $18,000 | $3,360 | $14,640 |
| 2023 | $2,984 | $18,000 | $3,360 | $14,640 |
| 2022 | $2,984 | $12,413 | $2,940 | $9,473 |
| 2021 | $4,909 | $12,413 | $2,940 | $9,473 |
| 2020 | $4,862 | $12,413 | $2,940 | $9,473 |
| 2019 | $4,379 | $11,444 | $2,730 | $8,714 |
| 2018 | $4,312 | $11,444 | $2,730 | $8,714 |
| 2017 | $4,224 | $11,444 | $2,730 | $8,714 |
| 2016 | $5,094 | $12,341 | $2,520 | $9,821 |
| 2015 | $4,938 | $12,341 | $2,520 | $9,821 |
| 2014 | $4,831 | $12,341 | $2,520 | $9,821 |
| 2013 | $5,268 | $14,080 | $2,520 | $11,560 |
Source: Public Records
Map
Nearby Homes
- 763 Cambridge Ave
- 5327 Northwestern Dr
- 5631 Colgate Ln
- 829 Princeton Ave
- 322 Central Ave
- 5503 Georgetown Dr
- 912 Princeton Ave
- 5620 Feathercreek Rd
- 5102 Monroe St
- 997 Regent Dr
- 1010 Regent Dr
- 175 Owen St
- 5804 Kathryn Ln
- 5628 Crestwood Rd
- 5808 Allemong Dr
- 20813 Homeland Rd
- 51 Manor Dr
- 78 Kenneth St
- 156 Cloverleaf Rd
- 744 Academy Ave
- 729 Bradley Ave
- 715 Bradley Ave
- 722 Cambridge Ave
- 728 Cambridge Ave
- 716 Cambridge Ave
- 735 Bradley Ave
- 707 Bradley Ave
- 724 Bradley Ave
- 708 Cambridge Ave
- 736 Cambridge Ave
- 718 Bradley Ave
- 732 Bradley Ave
- 701 Bradley Ave
- 710 Bradley Ave
- 743 Bradley Ave
- 702 Cambridge Ave
- 738 Bradley Ave
- 744 Cambridge Ave
- 704 Bradley Ave
- 5407 Yale Ln
Your Personal Tour Guide
Ask me questions while you tour the home.