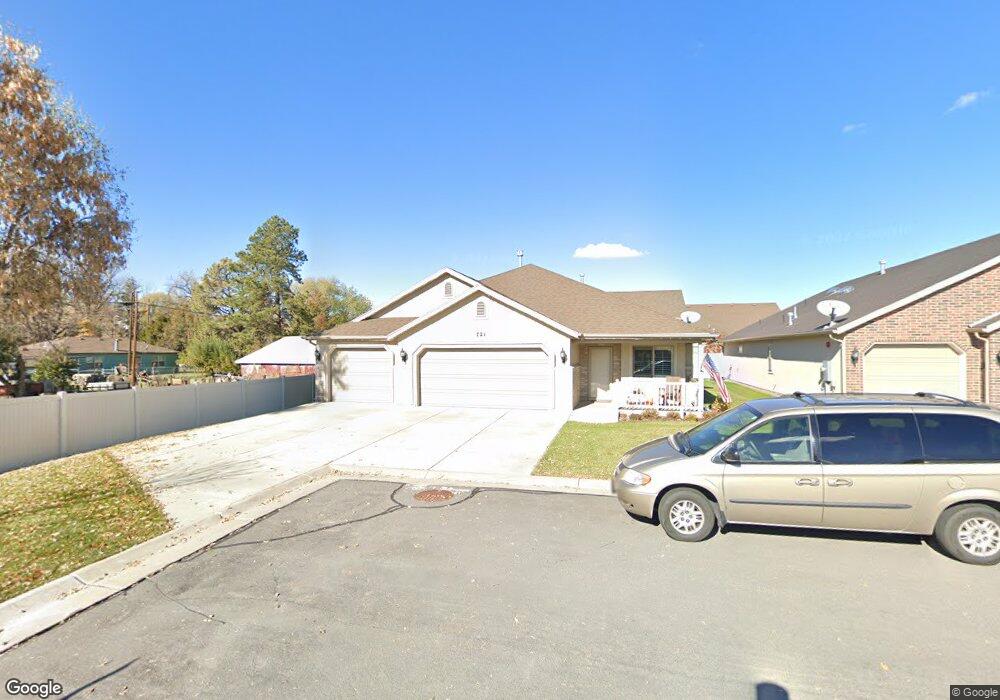
721 E 100 S Layton, UT 84041
Estimated Value: $608,000 - $628,000
3
Beds
2
Baths
2,111
Sq Ft
$291/Sq Ft
Est. Value
About This Home
This home is located at 721 E 100 S, Layton, UT 84041 and is currently estimated at $614,670, approximately $291 per square foot. 721 E 100 S is a home located in Davis County with nearby schools including Whitesides Elementary School, Fairfield Junior High School, and Layton High School.
Ownership History
Date
Name
Owned For
Owner Type
Purchase Details
Closed on
Dec 11, 2023
Sold by
Richey Carlton R
Bought by
Richey Carlton R
Current Estimated Value
Home Financials for this Owner
Home Financials are based on the most recent Mortgage that was taken out on this home.
Original Mortgage
$315,500
Outstanding Balance
$288,854
Interest Rate
7.03%
Mortgage Type
Construction
Estimated Equity
$325,816
Purchase Details
Closed on
May 12, 2022
Sold by
Nielson Family Trust
Bought by
Richey Carlton R
Purchase Details
Closed on
Mar 17, 2021
Sold by
Thompson Afton B
Bought by
Revoca Frank and Revoca Afton
Purchase Details
Closed on
Mar 12, 2021
Sold by
Thompson Bait S and Thompson Frank
Bought by
Nielson Maurice D and Nielson Juilanne J
Purchase Details
Closed on
Jun 28, 2012
Sold by
Colonial Builders Group Llc
Bought by
Thompson Frank and Thompson Afton
Home Financials for this Owner
Home Financials are based on the most recent Mortgage that was taken out on this home.
Original Mortgage
$209,700
Interest Rate
3.74%
Mortgage Type
Construction
Create a Home Valuation Report for This Property
The Home Valuation Report is an in-depth analysis detailing your home's value as well as a comparison with similar homes in the area
Home Values in the Area
Average Home Value in this Area
Purchase History
| Date | Buyer | Sale Price | Title Company |
|---|---|---|---|
| Richey Carlton R | -- | Lincoln Title | |
| Richey Carlton R | -- | Old Republic Title | |
| Revoca Frank | -- | -- | |
| Nielson Maurice D | -- | First American Title | |
| Thompson Frank | -- | Lincoln Title Insuran |
Source: Public Records
Mortgage History
| Date | Status | Borrower | Loan Amount |
|---|---|---|---|
| Open | Richey Carlton R | $315,500 | |
| Previous Owner | Thompson Frank | $209,700 |
Source: Public Records
Tax History
| Year | Tax Paid | Tax Assessment Tax Assessment Total Assessment is a certain percentage of the fair market value that is determined by local assessors to be the total taxable value of land and additions on the property. | Land | Improvement |
|---|---|---|---|---|
| 2025 | $2,924 | $306,901 | $99,545 | $207,356 |
| 2024 | $2,809 | $296,999 | $116,135 | $180,864 |
| 2023 | $2,736 | $280,500 | $76,689 | $203,810 |
| 2022 | $2,896 | $293,150 | $73,314 | $219,836 |
| 2021 | $2,643 | $399,000 | $101,766 | $297,234 |
| 2020 | $2,424 | $351,000 | $86,079 | $264,921 |
| 2019 | $2,390 | $339,000 | $82,167 | $256,833 |
| 2018 | $2,149 | $306,000 | $82,167 | $223,833 |
| 2016 | $1,751 | $128,645 | $25,959 | $102,686 |
| 2015 | $1,682 | $117,260 | $25,959 | $91,301 |
| 2014 | $2,078 | $148,189 | $25,959 | $122,230 |
| 2013 | -- | $145,375 | $21,523 | $123,852 |
Source: Public Records
Map
Nearby Homes
- 9 Colonial Ave
- 617 E 405 S
- 958 E 175 S
- 149 N Fort Ln Unit 1D
- 187 N Talbot Dr
- 1137 Holmes Creek Ln
- 504 E Alice Way
- 464 E Alice Way
- 586 Wasatch Dr
- 189 S Main St Unit 76
- 189 S Main St Unit 21
- 679 E Clearwater Dr
- 753 S 300 E
- 668 E Clearwater Dr
- 282 E 925 S
- 1368 E 275 S
- 508 N Adamswood Rd
- 556 N Fairfield Rd Unit A2
- 556 N Fairfield Rd Unit D1
- 556 N Fairfield Rd Unit D2
Your Personal Tour Guide
Ask me questions while you tour the home.