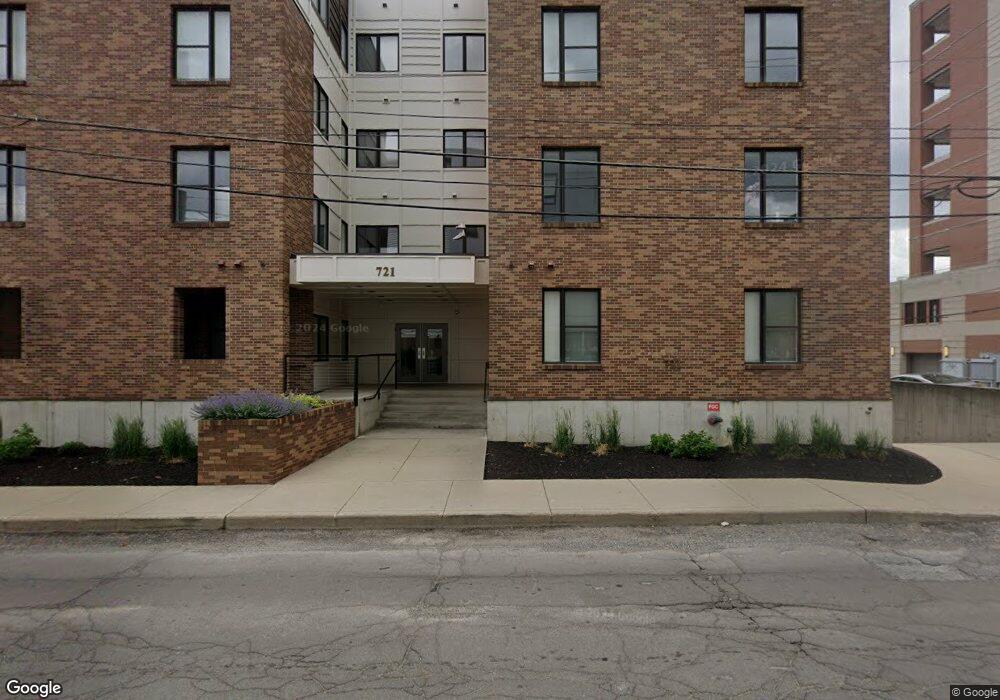
721 E North St Indianapolis, IN 46202
Lockerbie Square NeighborhoodEstimated Value: $341,000 - $406,000
Studio
--
Bath
1,351
Sq Ft
$278/Sq Ft
Est. Value
About This Home
This home is located at 721 E North St, Indianapolis, IN 46202 and is currently estimated at $376,076, approximately $278 per square foot. 721 E North St is a home located in Marion County with nearby schools including Washington Irving School 14, Thomas D. Gregg School No. 15, and Brookside School 54.
Ownership History
Date
Name
Owned For
Owner Type
Purchase Details
Closed on
May 11, 2022
Sold by
Allen Campbell
Bought by
Gray Mark S
Current Estimated Value
Home Financials for this Owner
Home Financials are based on the most recent Mortgage that was taken out on this home.
Original Mortgage
$266,250
Outstanding Balance
$245,267
Interest Rate
3.38%
Mortgage Type
New Conventional
Estimated Equity
$130,809
Purchase Details
Closed on
Apr 8, 2022
Sold by
Allen Campbell
Bought by
Gray Mark S
Home Financials for this Owner
Home Financials are based on the most recent Mortgage that was taken out on this home.
Original Mortgage
$266,250
Outstanding Balance
$245,267
Interest Rate
3.38%
Mortgage Type
New Conventional
Estimated Equity
$130,809
Purchase Details
Closed on
Dec 29, 2017
Sold by
Gritton Joshua D
Bought by
Allen Campbell
Home Financials for this Owner
Home Financials are based on the most recent Mortgage that was taken out on this home.
Original Mortgage
$250,000
Interest Rate
3.9%
Mortgage Type
New Conventional
Purchase Details
Closed on
Oct 29, 2015
Sold by
Dunkman Andrew G
Bought by
Gritton Joshua D
Home Financials for this Owner
Home Financials are based on the most recent Mortgage that was taken out on this home.
Original Mortgage
$254,250
Interest Rate
3.82%
Mortgage Type
New Conventional
Purchase Details
Closed on
Mar 27, 2012
Sold by
Springs Street Llc
Bought by
Acosta Adam M
Home Financials for this Owner
Home Financials are based on the most recent Mortgage that was taken out on this home.
Original Mortgage
$150,000
Interest Rate
3.95%
Mortgage Type
New Conventional
Create a Home Valuation Report for This Property
The Home Valuation Report is an in-depth analysis detailing your home's value as well as a comparison with similar homes in the area
Home Values in the Area
Average Home Value in this Area
Purchase History
We collect this data history from publicly available records. To have your information removed, we recommend requesting removal directly through your county’s website.
| Date | Buyer | Sale Price | Title Company |
|---|---|---|---|
| Gray Mark S | $355,000 | New Title Company Name | |
| Gray Mark S | $355,000 | New Title Company Name | |
| Allen Campbell | $349,900 | -- | |
| Campbell Allen | $349,900 | Chicago Title | |
| Gritton Joshua D | -- | First American Title Ins Co | |
| Acosta Adam M | -- | None Available |
Source: Public Records
Mortgage History
We collect this data history from publicly available records. To have your information removed, we recommend requesting removal directly through your county’s website.
| Date | Status | Borrower | Loan Amount |
|---|---|---|---|
| Open | Gray Mark S | $266,250 | |
| Closed | Gray Mark S | $266,250 | |
| Previous Owner | Campbell Allen | $250,000 | |
| Previous Owner | Gritton Joshua D | $254,250 | |
| Previous Owner | Acosta Adam M | $150,000 |
Source: Public Records
Tax History
| Year | Tax Paid | Tax Assessment Tax Assessment Total Assessment is a certain percentage of the fair market value that is determined by local assessors to be the total taxable value of land and additions on the property. | Land | Improvement |
|---|---|---|---|---|
| 2025 | $3,860 | $323,500 | $52,500 | $271,000 |
| 2024 | $3,886 | $322,100 | $52,500 | $269,600 |
| 2023 | $3,886 | $322,300 | $52,500 | $269,800 |
| 2022 | $3,726 | $307,100 | $52,500 | $254,600 |
| 2021 | $4,125 | $348,000 | $47,800 | $300,200 |
| 2020 | $4,241 | $356,300 | $47,800 | $308,500 |
| 2019 | $4,382 | $360,500 | $47,800 | $312,700 |
| 2018 | $4,429 | $360,800 | $47,800 | $313,000 |
| 2017 | $3,432 | $317,100 | $47,800 | $269,300 |
| 2016 | $3,069 | $290,100 | $47,800 | $242,300 |
| 2014 | $2,576 | $238,500 | $47,800 | $190,700 |
| 2013 | $2,974 | $256,900 | $47,800 | $209,100 |
Source: Public Records
Map
Nearby Homes
- 721 E North St Unit 1C
- 624 E Walnut St Unit 39
- 624 E Walnut St Unit 21
- 624 E Walnut St Unit 26
- 630 N College Ave Unit 408
- 757 Massachusetts Ave Unit 201
- 611 N Park Ave Unit 208
- 611 N Park Ave Unit 109
- 425 N College Ave
- 504 N Park Ave Unit 3
- 527 E North St
- 749 N Park Ave Unit A
- 346 N College Ave
- 513 Leon St
- 430 N Park Ave Unit 603-604
- 430 N Park Ave Unit 513
- 430 N Park Ave Unit 507
- 430 N Park Ave Unit 104
- 430 N Park Ave Unit 101
- 430 N Park Ave Unit 105
- 740 E North St Unit 101
- 740 E North St Unit 203
- 740 E North St
- 740 E North St Unit 202
- 740 E North St Unit 301
- 740 E North St Unit 201
- 740 E North St Unit 302
- 740 E North St Unit 301
- 740 E North St
- 740 E North St
- 740 E North St
- 541 Fynn Place
- 721 E North St Unit 2C
- 533 Fynn Place
- 537 Fynn Place
- 559 Fulton St
- Manchester at 735 Plan at
- Cambridge at 563 Plan at
- Manchester at 731 Plan at
- Manchester at 727 Plan at
Your Personal Tour Guide
Ask me questions while you tour the home.