Estimated Value: $131,000 - $145,000
3
Beds
2
Baths
1,222
Sq Ft
$112/Sq Ft
Est. Value
About This Home
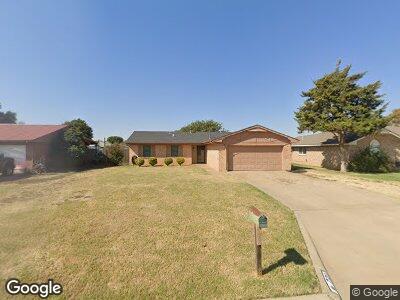
This home is located at 721 Hayes St, Altus, OK 73521 and is currently estimated at $136,476, approximately $111 per square foot. 721 Hayes St is a home located in Jackson County with nearby schools including Altus High School and Altus Christian Academy.
Ownership History
Date
Name
Owned For
Owner Type
Purchase Details
Closed on
Oct 25, 2022
Sold by
Chargualaf Jimmy H and Chargualaf Noreen B
Bought by
Tcct Family Trust
Current Estimated Value
Purchase Details
Closed on
Oct 5, 2007
Sold by
Thomas Ryan and Thomas Senona E
Bought by
Chargualaf Jimmy H and Chargualaf Noreen B
Home Financials for this Owner
Home Financials are based on the most recent Mortgage that was taken out on this home.
Original Mortgage
$88,870
Interest Rate
6.48%
Mortgage Type
New Conventional
Purchase Details
Closed on
Jun 20, 2007
Sold by
Watts Larry and Watts Josefina
Bought by
Thomas Ryan
Home Financials for this Owner
Home Financials are based on the most recent Mortgage that was taken out on this home.
Original Mortgage
$83,000
Interest Rate
6.54%
Mortgage Type
New Conventional
Purchase Details
Closed on
Mar 8, 2004
Sold by
Commercial Fed Bank
Purchase Details
Closed on
Apr 26, 1994
Sold by
Francis Douglas and Francis Francis
Create a Home Valuation Report for This Property
The Home Valuation Report is an in-depth analysis detailing your home's value as well as a comparison with similar homes in the area
Home Values in the Area
Average Home Value in this Area
Purchase History
| Date | Buyer | Sale Price | Title Company |
|---|---|---|---|
| Tcct Family Trust | -- | -- | |
| Chargualaf Jimmy H | $87,000 | None Available | |
| Thomas Ryan | $83,000 | None Available | |
| -- | $43,500 | -- | |
| -- | $73,000 | -- |
Source: Public Records
Mortgage History
| Date | Status | Borrower | Loan Amount |
|---|---|---|---|
| Previous Owner | Chargualaf Jimmy H | $88,870 | |
| Previous Owner | Thomas Ryan | $83,000 |
Source: Public Records
Tax History Compared to Growth
Tax History
| Year | Tax Paid | Tax Assessment Tax Assessment Total Assessment is a certain percentage of the fair market value that is determined by local assessors to be the total taxable value of land and additions on the property. | Land | Improvement |
|---|---|---|---|---|
| 2024 | -- | $11,213 | $1,523 | $9,690 |
| 2023 | $869 | $10,570 | $1,523 | $9,047 |
| 2022 | $869 | $10,262 | $1,523 | $8,739 |
| 2021 | $860 | $10,062 | $1,523 | $8,539 |
| 2020 | $862 | $9,958 | $1,954 | $8,004 |
| 2019 | $942 | $10,796 | $1,954 | $8,842 |
| 2018 | $806 | $10,796 | $1,954 | $8,842 |
| 2017 | $806 | $10,796 | $1,954 | $8,842 |
| 2016 | $782 | $10,471 | $1,177 | $9,294 |
| 2015 | $744 | $9,973 | $1,102 | $8,871 |
| 2014 | $721 | $9,657 | $1,102 | $8,555 |
Source: Public Records
Map
Nearby Homes
- 1601 Oxford Dr
- 816 Rosehaven Dr
- 801 Rosehaven Dr
- 613 Cambridge Dr
- 809 Rosehaven Dr
- 605 Cambridge Dr
- 704 Canterbury Blvd
- 1013 Village Dr
- 701 Canterbury Blvd
- 1005 Avalon Ct
- 1537 Avalon Dr
- 701 N Park Ln
- 1361 Canterbury Blvd
- 2308 Galaxy Dr
- 0 Lot 1 Red Bud Dr Unit 1152713
- 0 Redbud Ln Unit 1152710
- 1005 N Thomas St
- 1017 E Cypress St
- 1405 N York St
- 1013 E Cypress St