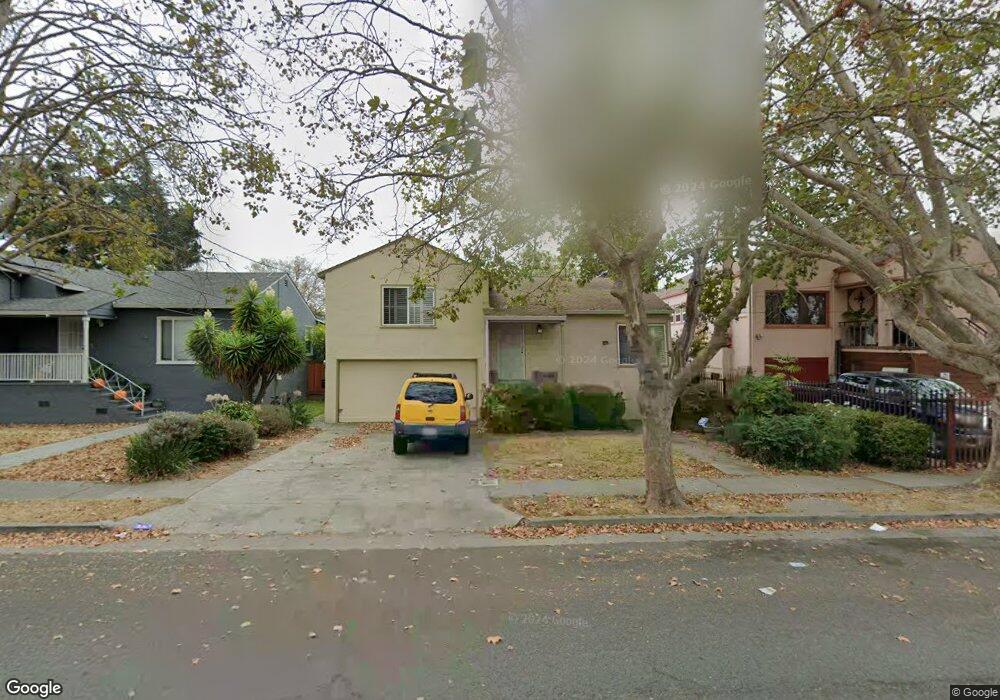
721 Illinois St Vallejo, CA 94590
Vallejo Heights NeighborhoodEstimated Value: $400,000 - $485,000
2
Beds
1
Bath
1,068
Sq Ft
$405/Sq Ft
Est. Value
About This Home
This home is located at 721 Illinois St, Vallejo, CA 94590 and is currently estimated at $432,691, approximately $405 per square foot. 721 Illinois St is a home located in Solano County with nearby schools including Highland Elementary, Vallejo High School, and Caliber: ChangeMakers Academy.
Ownership History
Date
Name
Owned For
Owner Type
Purchase Details
Closed on
Oct 16, 2017
Sold by
Holsten Martin Lee
Bought by
Holsten Martin L and Martin L Holsten Revocable Tru
Current Estimated Value
Purchase Details
Closed on
May 26, 2000
Sold by
Bell Paul S
Bought by
Holsten Martin Lee and Holsten Angelina Louise
Home Financials for this Owner
Home Financials are based on the most recent Mortgage that was taken out on this home.
Original Mortgage
$124,000
Outstanding Balance
$43,590
Interest Rate
8.18%
Estimated Equity
$389,101
Purchase Details
Closed on
Oct 27, 1998
Sold by
Turner Lance J and Turner Rebecca A
Bought by
Bell Paul S
Home Financials for this Owner
Home Financials are based on the most recent Mortgage that was taken out on this home.
Original Mortgage
$108,584
Interest Rate
6.6%
Mortgage Type
FHA
Purchase Details
Closed on
Nov 7, 1994
Sold by
Turner Lance J and Turner Rebecca A
Bought by
Turner Lance J and Turner Rebecca A
Create a Home Valuation Report for This Property
The Home Valuation Report is an in-depth analysis detailing your home's value as well as a comparison with similar homes in the area
Home Values in the Area
Average Home Value in this Area
Purchase History
| Date | Buyer | Sale Price | Title Company |
|---|---|---|---|
| Holsten Martin L | -- | None Available | |
| Holsten Martin Lee | $180,000 | Fidelity National Title Co | |
| Bell Paul S | $109,500 | Fidelity National Title Co | |
| Turner Lance J | -- | -- | |
| Turner Lance J | -- | -- |
Source: Public Records
Mortgage History
| Date | Status | Borrower | Loan Amount |
|---|---|---|---|
| Open | Holsten Martin Lee | $124,000 | |
| Previous Owner | Bell Paul S | $108,584 |
Source: Public Records
Tax History
| Year | Tax Paid | Tax Assessment Tax Assessment Total Assessment is a certain percentage of the fair market value that is determined by local assessors to be the total taxable value of land and additions on the property. | Land | Improvement |
|---|---|---|---|---|
| 2025 | $4,200 | $276,646 | $53,786 | $222,860 |
| 2024 | $4,200 | $271,223 | $52,732 | $218,491 |
| 2023 | $3,950 | $265,906 | $51,699 | $214,207 |
| 2022 | $3,855 | $260,693 | $50,686 | $210,007 |
| 2021 | $3,770 | $255,583 | $49,693 | $205,890 |
| 2020 | $3,783 | $252,963 | $49,184 | $203,779 |
| 2019 | $3,666 | $248,004 | $48,220 | $199,784 |
| 2018 | $3,430 | $243,142 | $47,275 | $195,867 |
| 2017 | $3,275 | $238,376 | $46,349 | $192,027 |
| 2016 | $2,706 | $233,703 | $45,441 | $188,262 |
| 2015 | $2,269 | $195,000 | $31,000 | $164,000 |
| 2014 | $1,892 | $161,000 | $26,000 | $135,000 |
Source: Public Records
Map
Nearby Homes
- 900 Alameda St
- 327 Arkansas St
- 325 Arkansas St
- 1131 Tennessee St
- 1038 Alabama St
- 1158 Louisiana St
- 1208 Amador St
- 125 Broadway St
- 1314 Ohio St
- 939 Ohio St
- 17 Hanns Ave
- 1117 El Dorado
- 215 Hampshire St
- 2328 Napa St
- 0 Broadway
- 918 Alameda St
- 0 Mississippi St
- 240 Mississippi St
- 844 Kentucky St
- 1322 Sutter St
Your Personal Tour Guide
Ask me questions while you tour the home.