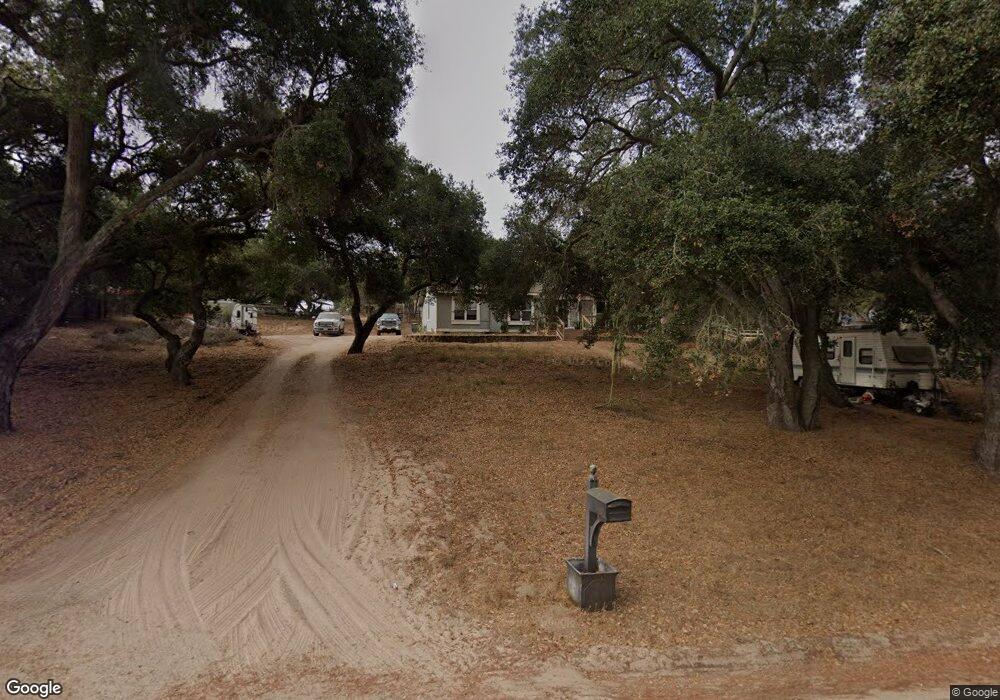
721 Live Oak Ridge Rd Nipomo, CA 93444
Estimated Value: $941,007 - $1,290,000
3
Beds
2
Baths
1,904
Sq Ft
$565/Sq Ft
Est. Value
About This Home
This home is located at 721 Live Oak Ridge Rd, Nipomo, CA 93444 and is currently estimated at $1,076,252, approximately $565 per square foot. 721 Live Oak Ridge Rd is a home located in San Luis Obispo County with nearby schools including Dorothea Lange Elementary School, Mesa Middle School, and Nipomo High School.
Ownership History
Date
Name
Owned For
Owner Type
Purchase Details
Closed on
Mar 8, 2021
Sold by
Delorenzo Paul and Delorenzo Karen M
Bought by
Delorenzo Paul and Delorenzo Karen M
Current Estimated Value
Home Financials for this Owner
Home Financials are based on the most recent Mortgage that was taken out on this home.
Original Mortgage
$328,000
Outstanding Balance
$243,119
Interest Rate
2.7%
Mortgage Type
New Conventional
Estimated Equity
$833,133
Purchase Details
Closed on
May 3, 1994
Sold by
Edwards Robert M and Edwards Peggy J
Bought by
Delorenzo Paul and Delorenzo Karen
Home Financials for this Owner
Home Financials are based on the most recent Mortgage that was taken out on this home.
Original Mortgage
$171,000
Interest Rate
4.5%
Purchase Details
Closed on
Dec 8, 1993
Sold by
Aafs Inc
Bought by
Edwards Robert M and Edwards Peggy J
Create a Home Valuation Report for This Property
The Home Valuation Report is an in-depth analysis detailing your home's value as well as a comparison with similar homes in the area
Home Values in the Area
Average Home Value in this Area
Purchase History
| Date | Buyer | Sale Price | Title Company |
|---|---|---|---|
| Delorenzo Paul | -- | Placer Title Company | |
| Delorenzo Paul | $190,000 | Cuesta Title Guaranty Co | |
| Edwards Robert M | $70,905 | -- |
Source: Public Records
Mortgage History
| Date | Status | Borrower | Loan Amount |
|---|---|---|---|
| Open | Delorenzo Paul | $328,000 | |
| Closed | Delorenzo Paul | $171,000 |
Source: Public Records
Tax History Compared to Growth
Tax History
| Year | Tax Paid | Tax Assessment Tax Assessment Total Assessment is a certain percentage of the fair market value that is determined by local assessors to be the total taxable value of land and additions on the property. | Land | Improvement |
|---|---|---|---|---|
| 2025 | $3,248 | $322,900 | $178,446 | $144,454 |
| 2024 | $3,209 | $316,570 | $174,948 | $141,622 |
| 2023 | $3,209 | $310,364 | $171,518 | $138,846 |
| 2022 | $3,159 | $304,279 | $168,155 | $136,124 |
| 2021 | $3,152 | $298,313 | $164,858 | $133,455 |
| 2020 | $3,115 | $295,255 | $163,168 | $132,087 |
| 2019 | $3,095 | $289,467 | $159,969 | $129,498 |
| 2018 | $3,056 | $283,792 | $156,833 | $126,959 |
| 2017 | $2,998 | $278,228 | $153,758 | $124,470 |
| 2016 | $2,826 | $272,774 | $150,744 | $122,030 |
| 2015 | $2,784 | $268,677 | $148,480 | $120,197 |
| 2014 | $2,679 | $263,415 | $145,572 | $117,843 |
Source: Public Records
Map
Nearby Homes
- 1010 1012 Upper Los Berros Rd
- 620 Camino Roble
- 940 Calle Fresa
- 615 Sweet Donna Place
- 875 Camino Caballo
- 1150 Redberry Place
- 219 Lema Dr
- 217 Hope Way
- 231 Trevino Dr
- 228 Chaparral Ln
- 7855 Suey Creek Rd
- 255 Encino Ln
- 1225 Dawn Rd
- 1276 Pomeroy Rd
- 1060 Dawn Rd
- 759 Viola Ct
- 639 Barberry Way
- 1337 Black Sage Cir
- 719 W Tefft St
- 400 N Oakglen Ave
- 737 Live Oak Ridge Rd
- 715 Live Oak Ridge Rd
- 724 Ridge Rd
- 744 Ridge Rd
- 704 Ridge Rd
- 749 Live Oak Ridge Rd
- 731 Ridge Rd
- 686 Hetrick Ave
- 745 Ridge Rd
- 756 Ridge Rd
- 715 Ridge Rd
- 755 Ridge Rd
- 690 Cherokee Place
- 763 Live Oak Ridge Rd
- 770 Ridge Rd
- 770 Ridge Rd Unit A
- 750 Glenhaven Place
- 680 Cherokee Place
- 734 Glenhaven Place
- 771 Ridge Rd