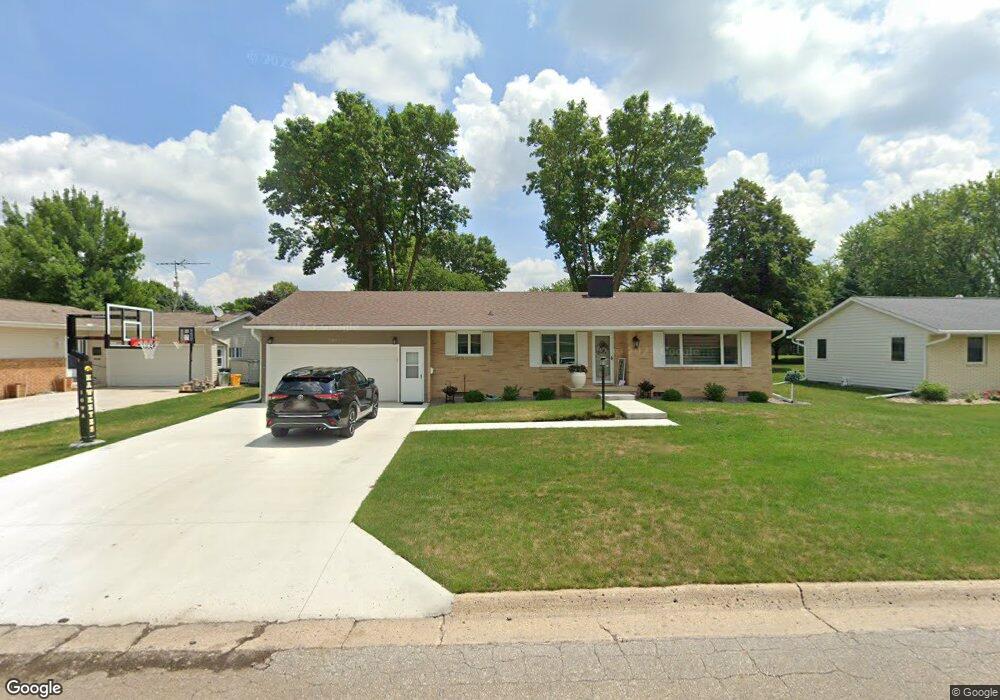
721 Maple Ln Clarion, IA 50525
Estimated Value: $226,509 - $319,000
3
Beds
3
Baths
1,470
Sq Ft
$172/Sq Ft
Est. Value
About This Home
This home is located at 721 Maple Ln, Clarion, IA 50525 and is currently estimated at $253,127, approximately $172 per square foot. 721 Maple Ln is a home with nearby schools including Clarion-Goldfield-Dows Elementary School, Clarion-Goldfield-Dows Middle School, and Clarion-Goldfield-Dows High School.
Ownership History
Date
Name
Owned For
Owner Type
Purchase Details
Closed on
May 17, 2018
Sold by
Diamond Joshua G and Diamond Renee B
Bought by
Simmons Scott A and Simmons Kairna L
Current Estimated Value
Purchase Details
Closed on
Sep 25, 2017
Sold by
Dames Matthew and Dames Amanda
Bought by
Diamond Joshua Gregory and Diamond Renee Beth
Home Financials for this Owner
Home Financials are based on the most recent Mortgage that was taken out on this home.
Original Mortgage
$143,587
Interest Rate
3.82%
Mortgage Type
VA
Create a Home Valuation Report for This Property
The Home Valuation Report is an in-depth analysis detailing your home's value as well as a comparison with similar homes in the area
Home Values in the Area
Average Home Value in this Area
Purchase History
| Date | Buyer | Sale Price | Title Company |
|---|---|---|---|
| Simmons Scott A | $236,500 | -- | |
| Diamond Joshua Gregory | -- | None Available |
Source: Public Records
Mortgage History
| Date | Status | Borrower | Loan Amount |
|---|---|---|---|
| Previous Owner | Diamond Joshua Gregory | $143,587 |
Source: Public Records
Tax History Compared to Growth
Tax History
| Year | Tax Paid | Tax Assessment Tax Assessment Total Assessment is a certain percentage of the fair market value that is determined by local assessors to be the total taxable value of land and additions on the property. | Land | Improvement |
|---|---|---|---|---|
| 2025 | $3,716 | $254,200 | $17,000 | $237,200 |
| 2024 | $3,716 | $204,200 | $17,000 | $187,200 |
| 2023 | $3,692 | $204,200 | $17,000 | $187,200 |
| 2022 | $3,122 | $173,100 | $17,000 | $156,100 |
| 2021 | $3,122 | $147,500 | $17,000 | $130,500 |
| 2020 | $3,365 | $151,300 | $17,000 | $134,300 |
| 2019 | $3,159 | $140,800 | $0 | $0 |
| 2018 | $3,104 | $137,500 | $0 | $0 |
| 2017 | $3,044 | $135,400 | $0 | $0 |
| 2016 | $2,922 | $135,400 | $0 | $0 |
| 2015 | $2,794 | $135,400 | $0 | $0 |
| 2014 | $2,794 | $115,800 | $0 | $0 |
Source: Public Records
Map
Nearby Homes