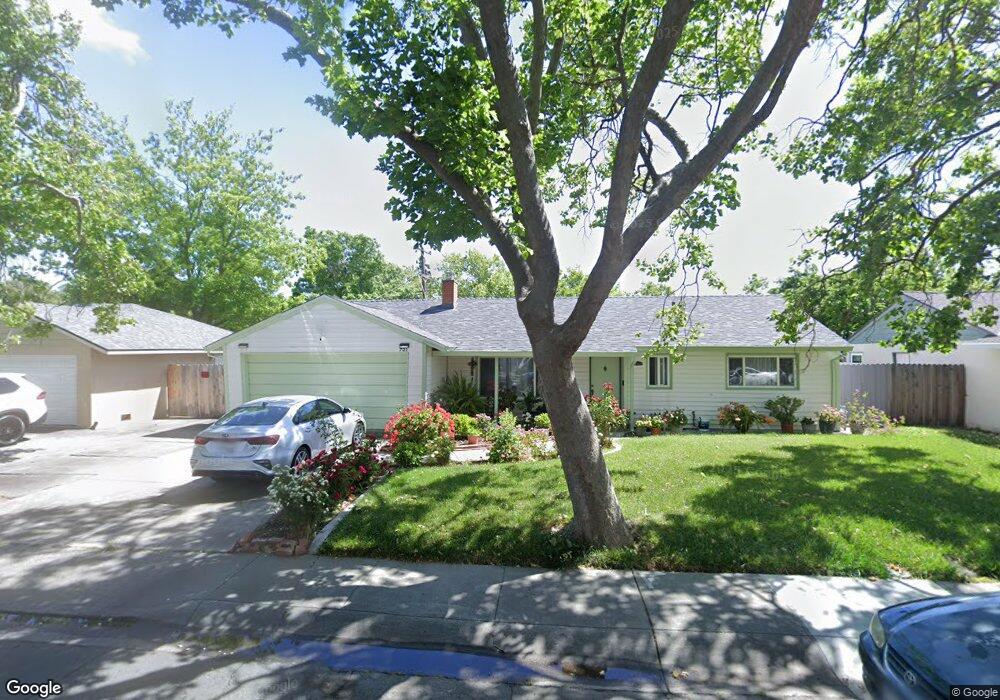
721 Nevada St Fairfield, CA 94533
Estimated Value: $435,000 - $486,000
3
Beds
1
Bath
1,034
Sq Ft
$439/Sq Ft
Est. Value
About This Home
This home is located at 721 Nevada St, Fairfield, CA 94533 and is currently estimated at $453,544, approximately $438 per square foot. 721 Nevada St is a home located in Solano County with nearby schools including Fairview Elementary School, Crystal Middle School, and Armijo High School.
Ownership History
Date
Name
Owned For
Owner Type
Purchase Details
Closed on
Apr 20, 2001
Sold by
Franco Ruben
Bought by
Franco Ruben and Franco Teresa
Current Estimated Value
Purchase Details
Closed on
May 4, 1999
Sold by
Franco Teresa
Bought by
Franco Ruben
Home Financials for this Owner
Home Financials are based on the most recent Mortgage that was taken out on this home.
Original Mortgage
$85,276
Outstanding Balance
$21,851
Interest Rate
6.94%
Mortgage Type
FHA
Estimated Equity
$431,693
Create a Home Valuation Report for This Property
The Home Valuation Report is an in-depth analysis detailing your home's value as well as a comparison with similar homes in the area
Home Values in the Area
Average Home Value in this Area
Purchase History
| Date | Buyer | Sale Price | Title Company |
|---|---|---|---|
| Franco Ruben | -- | -- | |
| Franco Ruben | -- | North American Title Co | |
| Franco Ruben | $98,000 | North American Title Co |
Source: Public Records
Mortgage History
| Date | Status | Borrower | Loan Amount |
|---|---|---|---|
| Open | Franco Ruben | $85,276 | |
| Closed | Franco Ruben | $14,600 |
Source: Public Records
Tax History Compared to Growth
Tax History
| Year | Tax Paid | Tax Assessment Tax Assessment Total Assessment is a certain percentage of the fair market value that is determined by local assessors to be the total taxable value of land and additions on the property. | Land | Improvement |
|---|---|---|---|---|
| 2025 | $1,695 | $156,855 | $62,704 | $94,151 |
| 2024 | $1,695 | $153,780 | $61,475 | $92,305 |
| 2023 | $1,642 | $150,766 | $60,270 | $90,496 |
| 2022 | $1,620 | $147,811 | $59,090 | $88,721 |
| 2021 | $1,603 | $144,914 | $57,932 | $86,982 |
| 2020 | $1,565 | $143,429 | $57,338 | $86,091 |
| 2019 | $1,526 | $140,617 | $56,214 | $84,403 |
| 2018 | $1,573 | $137,861 | $55,112 | $82,749 |
| 2017 | $1,499 | $135,159 | $54,032 | $81,127 |
| 2016 | $1,479 | $132,510 | $52,973 | $79,537 |
| 2015 | $1,380 | $130,521 | $52,178 | $78,343 |
| 2014 | $1,366 | $127,965 | $51,156 | $76,809 |
Source: Public Records
Map
Nearby Homes
- 647 Nevada St
- 712 Maryland St
- 1306 Washington St
- 1316 Lincoln St
- 745 Jackson St
- 518 Empire St
- 1032 Tyler St
- 0 Madison St
- 812 Delaware St
- 728 Delaware St
- 1042 Harding St
- 1201 Missouri St
- 935 Delaware St
- 1700 Fillmore St
- 133 E Travis Blvd
- 817 Broadway St
- 1407 Minnesota St
- 954 Coventry Ln
- 927 Broadway St
- 224 E Colorado St