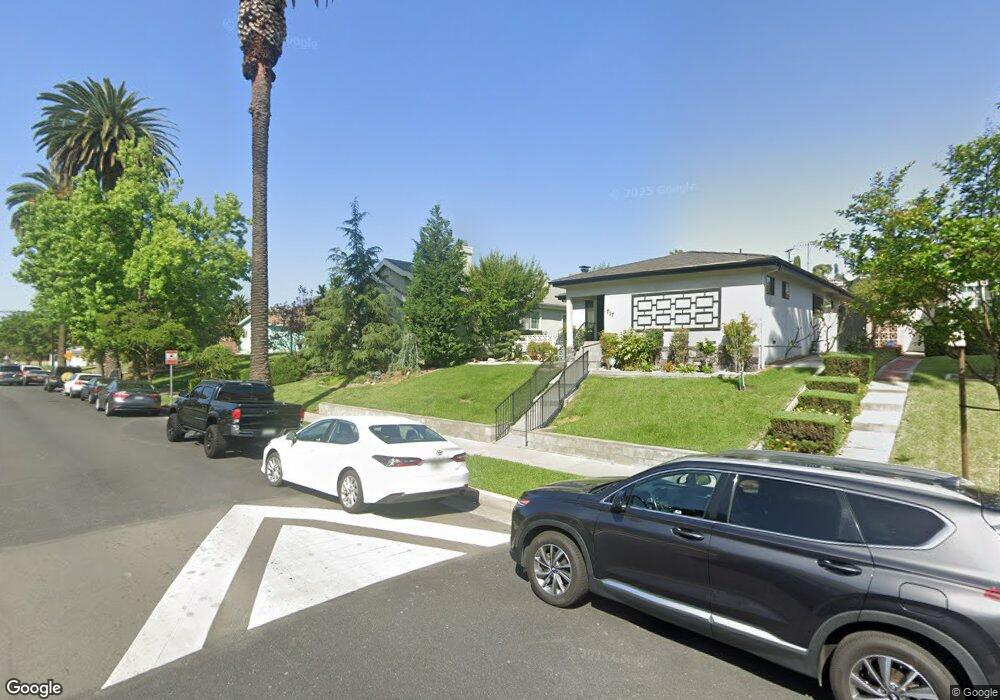
721 S Ynez Ave Monterey Park, CA 91754
Estimated Value: $1,022,000 - $1,222,000
4
Beds
3
Baths
2,314
Sq Ft
$487/Sq Ft
Est. Value
About This Home
This home is located at 721 S Ynez Ave, Monterey Park, CA 91754 and is currently estimated at $1,126,489, approximately $486 per square foot. 721 S Ynez Ave is a home located in Los Angeles County with nearby schools including Brightwood Elementary School, Mark Keppel High School, and St. Stephen Martyr School.
Ownership History
Date
Name
Owned For
Owner Type
Purchase Details
Closed on
Aug 19, 2011
Sold by
Melendrez Guadalupe and The Lupe Melendrez Living Trus
Bought by
Melendrez Guadalupe
Current Estimated Value
Purchase Details
Closed on
Jul 14, 2011
Sold by
Melendrez Guadalupe
Bought by
Melendrez Guadalupe and The Lupe Melendrez Living Trust
Purchase Details
Closed on
May 30, 2002
Sold by
Melendrez Maria G
Bought by
The Lupe Melendrez Living Trust
Purchase Details
Closed on
Sep 5, 1996
Sold by
Castaneda Joanne C
Bought by
Melendrez Maria G
Purchase Details
Closed on
Apr 14, 1994
Sold by
Liu Stuart Shih Ying and Liu Rita H J
Bought by
Melendrez Maria G
Home Financials for this Owner
Home Financials are based on the most recent Mortgage that was taken out on this home.
Original Mortgage
$202,350
Interest Rate
6.75%
Create a Home Valuation Report for This Property
The Home Valuation Report is an in-depth analysis detailing your home's value as well as a comparison with similar homes in the area
Home Values in the Area
Average Home Value in this Area
Purchase History
| Date | Buyer | Sale Price | Title Company |
|---|---|---|---|
| Melendrez Guadalupe | -- | None Available | |
| Melendrez Guadalupe | -- | None Available | |
| The Lupe Melendrez Living Trust | -- | -- | |
| Melendrez Maria G | -- | American Title Ins Co | |
| Melendrez Maria G | $213,000 | Continental Lawyers Title Co |
Source: Public Records
Mortgage History
| Date | Status | Borrower | Loan Amount |
|---|---|---|---|
| Previous Owner | Melendrez Maria G | $202,350 |
Source: Public Records
Tax History Compared to Growth
Tax History
| Year | Tax Paid | Tax Assessment Tax Assessment Total Assessment is a certain percentage of the fair market value that is determined by local assessors to be the total taxable value of land and additions on the property. | Land | Improvement |
|---|---|---|---|---|
| 2025 | $7,165 | $523,773 | $186,699 | $337,074 |
| 2024 | $6,928 | $513,504 | $183,039 | $330,465 |
| 2023 | $6,107 | $449,729 | $179,462 | $270,267 |
| 2022 | $5,823 | $440,912 | $175,944 | $264,968 |
| 2021 | $5,744 | $432,268 | $172,495 | $259,773 |
| 2020 | $5,710 | $427,837 | $170,727 | $257,110 |
| 2019 | $5,541 | $419,449 | $167,380 | $252,069 |
| 2018 | $5,503 | $411,226 | $164,099 | $247,127 |
| 2016 | $5,079 | $395,260 | $157,728 | $237,532 |
| 2015 | $4,999 | $389,324 | $155,359 | $233,965 |
| 2014 | $4,932 | $381,698 | $152,316 | $229,382 |
Source: Public Records
Map
Nearby Homes
- 824 De la Fuente St
- 419 S Chandler Ave Unit 521
- 408 De la Fuente St
- 701 S Garfield Ave
- 1100 S Grandridge Ave
- 1240 S Ynez Ave
- 1027 De la Fuente St
- 863 S Lincoln Ave
- 311 Montechico Dr
- 1141 Williams St
- 1351 S Ynez Ave
- 1301 S Atlantic Blvd Unit 234C
- 1701 S Mcpherrin Ave
- 125 S Moore Ave Unit 2
- 421 S Garfield Ave Unit 79
- 411 S Garfield Ave
- 438 S Garfield Ave Unit E
- 259 Fremont Ave
- 1800 Fernbank Ave
- 0 Garvey Ave Unit MB21123625
- 717 S Ynez Ave
- 725 S Ynez Ave
- 715 S Ynez Ave
- 729 S Ynez Ave
- 711 S Ynez Ave
- 714 Fotini Place
- 712 Fotini Place
- 726 S Ynez Ave
- 733 S Ynez Ave
- 718 Fotini Place
- 706 Fotini Place
- 732 S Ynez Ave
- 720 Triana St
- 720 Fotini Place
- 736 S Ynez Ave
- 724 S Ynez Ave
- 707 S Ynez Ave
- 720 S Ynez Ave
- 737 S Ynez Ave
- 724 Fotini Place