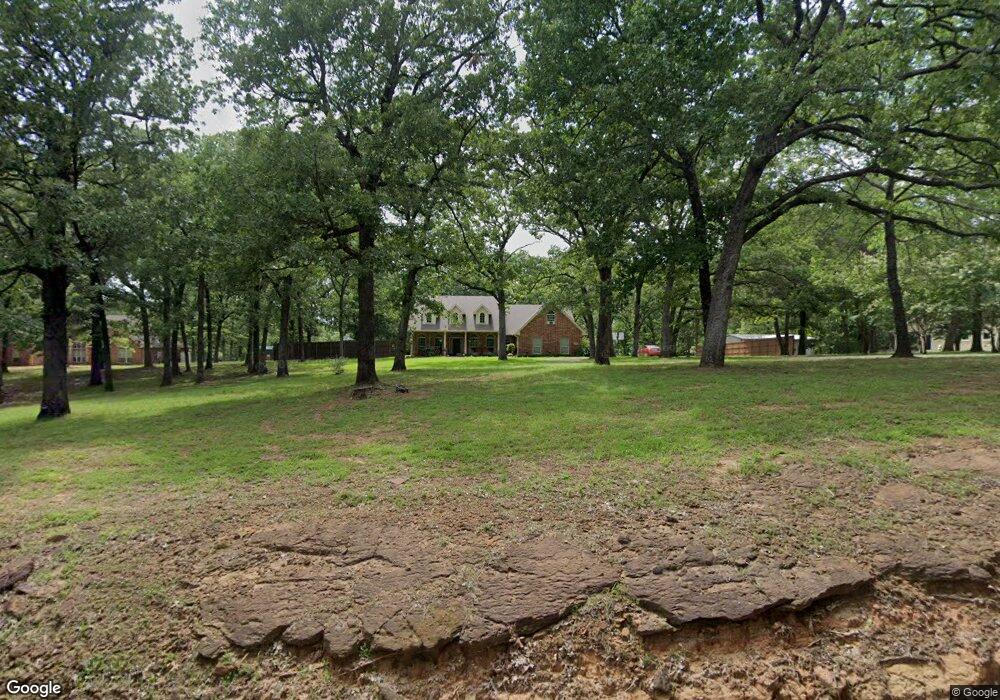
721 Square Dance Rd Denison, TX 75021
Estimated Value: $550,642 - $624,000
3
Beds
2
Baths
2,131
Sq Ft
$276/Sq Ft
Est. Value
About This Home
This home is located at 721 Square Dance Rd, Denison, TX 75021 and is currently estimated at $587,321, approximately $275 per square foot. 721 Square Dance Rd is a home located in Grayson County with nearby schools including Lamar Elementary School, Scott Middle School, and Denison High School.
Ownership History
Date
Name
Owned For
Owner Type
Purchase Details
Closed on
Dec 16, 2016
Sold by
Cohn Zachary Stewart
Bought by
Boston Carrie Renee
Current Estimated Value
Home Financials for this Owner
Home Financials are based on the most recent Mortgage that was taken out on this home.
Original Mortgage
$235,800
Outstanding Balance
$194,069
Interest Rate
4.16%
Mortgage Type
New Conventional
Estimated Equity
$393,252
Purchase Details
Closed on
May 26, 2016
Sold by
Kyle Kari Uber
Bought by
Boston Carrie and Cohn Zachary
Home Financials for this Owner
Home Financials are based on the most recent Mortgage that was taken out on this home.
Original Mortgage
$235,800
Interest Rate
3.64%
Purchase Details
Closed on
Feb 15, 2005
Sold by
Shepherd & Shepherd Inc
Bought by
Uber Kyle and Uber Kari
Home Financials for this Owner
Home Financials are based on the most recent Mortgage that was taken out on this home.
Original Mortgage
$29,000
Interest Rate
5.27%
Mortgage Type
Purchase Money Mortgage
Create a Home Valuation Report for This Property
The Home Valuation Report is an in-depth analysis detailing your home's value as well as a comparison with similar homes in the area
Home Values in the Area
Average Home Value in this Area
Purchase History
| Date | Buyer | Sale Price | Title Company |
|---|---|---|---|
| Boston Carrie Renee | -- | None Available | |
| Boston Carrie | -- | -- | |
| Uber Kyle | -- | -- |
Source: Public Records
Mortgage History
| Date | Status | Borrower | Loan Amount |
|---|---|---|---|
| Open | Boston Carrie Renee | $235,800 | |
| Previous Owner | Boston Carrie | $235,800 | |
| Previous Owner | Boston Carrie | -- | |
| Previous Owner | Uber Kyle | $29,000 |
Source: Public Records
Tax History
| Year | Tax Paid | Tax Assessment Tax Assessment Total Assessment is a certain percentage of the fair market value that is determined by local assessors to be the total taxable value of land and additions on the property. | Land | Improvement |
|---|---|---|---|---|
| 2025 | -- | $532,092 | -- | -- |
| 2024 | $10,398 | $447,537 | $0 | $0 |
| 2023 | $1,727 | $406,852 | $0 | $0 |
| 2022 | $8,788 | $369,865 | $0 | $0 |
| 2021 | $8,480 | $371,567 | $88,001 | $283,566 |
| 2020 | $8,063 | $305,674 | $48,718 | $256,956 |
| 2019 | $7,743 | $308,216 | $48,718 | $259,498 |
| 2018 | $7,096 | $255,793 | $44,656 | $211,137 |
| 2017 | $7,156 | $255,793 | $44,656 | $211,137 |
| 2016 | $5,975 | $213,582 | $32,893 | $180,689 |
Source: Public Records
Map
Nearby Homes
- 124 Mark Dr
- 125 Mark Dr
- 513 Joy Ln
- 413 Rolling Acres Rd
- 516 Forrest Ln
- 2526 S Fannin Ave Unit 2600
- 246 Karen Dr
- 40 Sheryl Ln
- 501 W Collins St
- 618 Star St
- 422 W Coffin St
- 2931 S Barrett Ave
- 153 Circle Dr
- 1747 Desvoignes Rd
- 711 Dubois St
- 227 Sheryl Ln
- 701 W Star St
- 509 W Coffin St
- 513 W Coffin St
- 614 Rice St
- 755 Square Dance Rd
- 683 Square Dance Rd
- 651 Square Dance Rd
- 613 Square Dance Rd
- 785 Square Dance Rd
- 870 Square Dance Rd
- 823 Square Dance Rd
- 413 Square Dance Rd
- 393 Square Dance Rd
- 369 Square Dance Rd
- 404 Square Dance Rd
- 327 Square Dance Rd
- 1024 Square Dance Rd
- 303 Square Dance Rd
- 580 Square Dance Rd
- 283 Square Dance Rd
- 251 Square Dance Rd
- 1056 Square Dance Rd
- 227 Square Dance Rd
- 1073 Desvoignes Rd
Your Personal Tour Guide
Ask me questions while you tour the home.