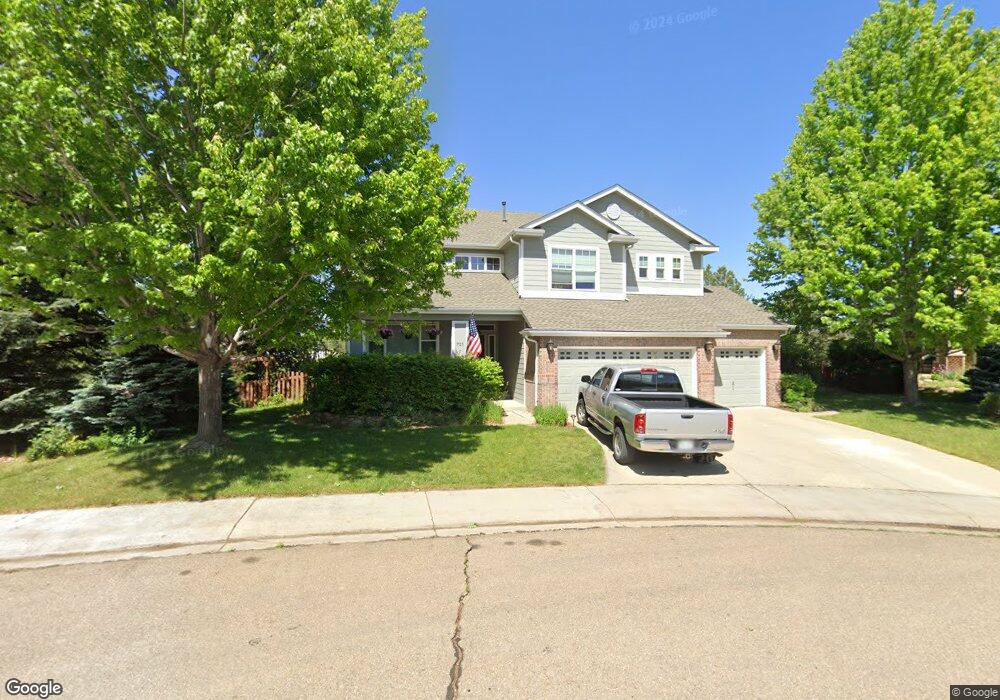
721 Teal Cir Longmont, CO 80503
Longmont Estates NeighborhoodEstimated Value: $888,651 - $918,000
4
Beds
4
Baths
2,911
Sq Ft
$309/Sq Ft
Est. Value
About This Home
This home is located at 721 Teal Cir, Longmont, CO 80503 and is currently estimated at $898,913, approximately $308 per square foot. 721 Teal Cir is a home located in Boulder County with nearby schools including Longmont Estates Elementary School, Westview Middle School, and Silver Creek High School.
Ownership History
Date
Name
Owned For
Owner Type
Purchase Details
Closed on
Feb 23, 2018
Sold by
Sterne Robin and Godec Richard D
Bought by
Wetzel Jason
Current Estimated Value
Home Financials for this Owner
Home Financials are based on the most recent Mortgage that was taken out on this home.
Original Mortgage
$464,000
Outstanding Balance
$392,966
Interest Rate
3.99%
Mortgage Type
New Conventional
Estimated Equity
$505,947
Purchase Details
Closed on
Jun 21, 2005
Sold by
Nelson Brian S and Nelson Shelley S
Bought by
Sterne Robin
Home Financials for this Owner
Home Financials are based on the most recent Mortgage that was taken out on this home.
Original Mortgage
$110,000
Interest Rate
5.76%
Mortgage Type
Fannie Mae Freddie Mac
Purchase Details
Closed on
Aug 1, 2001
Sold by
Brittany Builders Inc
Bought by
Nelson Brian S
Home Financials for this Owner
Home Financials are based on the most recent Mortgage that was taken out on this home.
Original Mortgage
$336,900
Interest Rate
7.07%
Create a Home Valuation Report for This Property
The Home Valuation Report is an in-depth analysis detailing your home's value as well as a comparison with similar homes in the area
Home Values in the Area
Average Home Value in this Area
Purchase History
| Date | Buyer | Sale Price | Title Company |
|---|---|---|---|
| Wetzel Jason | $580,000 | First American Title | |
| Sterne Robin | $460,000 | -- | |
| Nelson Brian S | $421,127 | Chicago Title Co | |
| Brittany Builders Inc | -- | Chicago Title Co |
Source: Public Records
Mortgage History
| Date | Status | Borrower | Loan Amount |
|---|---|---|---|
| Open | Wetzel Jason | $464,000 | |
| Previous Owner | Sterne Robin | $110,000 | |
| Previous Owner | Nelson Brian S | $336,900 | |
| Closed | Nelson Brian S | $42,110 |
Source: Public Records
Tax History Compared to Growth
Tax History
| Year | Tax Paid | Tax Assessment Tax Assessment Total Assessment is a certain percentage of the fair market value that is determined by local assessors to be the total taxable value of land and additions on the property. | Land | Improvement |
|---|---|---|---|---|
| 2025 | $5,868 | $60,300 | $7,194 | $53,106 |
| 2024 | $5,868 | $60,300 | $7,194 | $53,106 |
| 2023 | $5,788 | $61,345 | $6,821 | $58,210 |
| 2022 | $4,776 | $48,267 | $7,311 | $40,956 |
| 2021 | $4,838 | $49,657 | $7,522 | $42,135 |
| 2020 | $4,150 | $42,721 | $7,722 | $34,999 |
| 2019 | $4,084 | $42,721 | $7,722 | $34,999 |
| 2018 | $3,724 | $39,204 | $7,560 | $31,644 |
| 2017 | $3,673 | $43,342 | $8,358 | $34,984 |
| 2016 | $3,346 | $35,008 | $10,109 | $24,899 |
| 2015 | $3,189 | $28,855 | $7,960 | $20,895 |
| 2014 | $2,695 | $28,855 | $7,960 | $20,895 |
Source: Public Records
Map
Nearby Homes
- 883 Widgeon Cir
- 715 Hover St
- 818 Hover St
- 301 Widgeon Ln
- 712 Wade Rd
- 825 Wade Rd
- 707 Longs Peak Ln
- 24 Cedar Ct
- 835 Hillside Ct
- 1037 Purdue Dr
- 2900 Troxell Ave
- 1013 Berkeley Ct
- 305 Cottonwood Ct
- 1106 Purdue Dr
- 2103 Rangeview Ln
- 1221 Kiteley Ln
- 895 Faith Ct
- 1262 Lanyon Ln
- 1950 Spruce Ave
- 1379 Charles Dr Unit 7