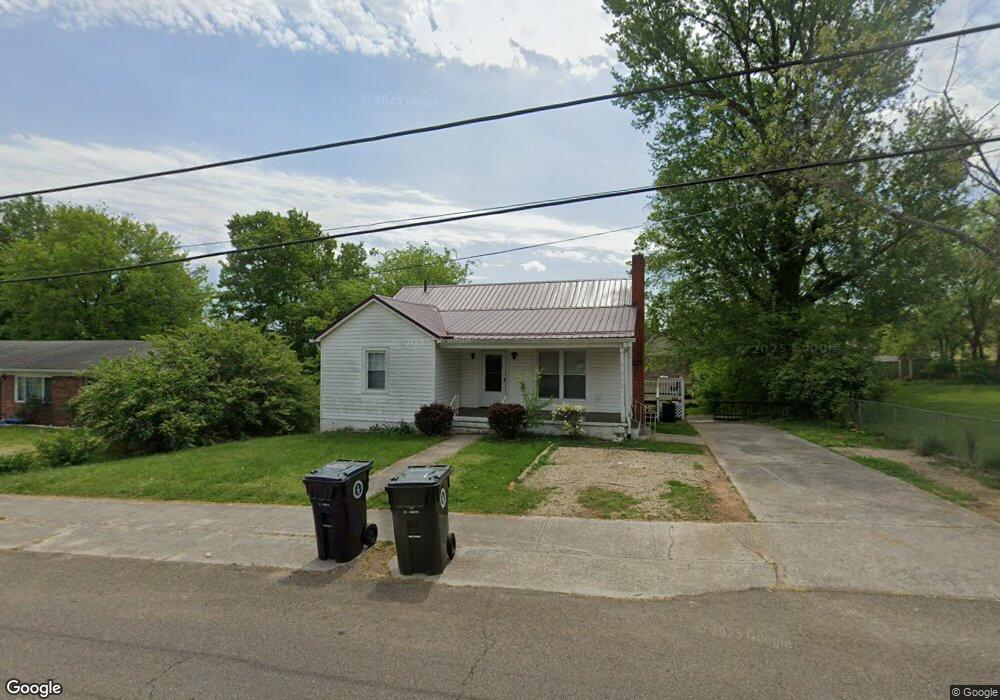
721 W 3rd North St Morristown, TN 37814
Estimated Value: $195,000 - $334,000
2
Beds
1
Bath
1,020
Sq Ft
$235/Sq Ft
Est. Value
About This Home
This home is located at 721 W 3rd North St, Morristown, TN 37814 and is currently estimated at $239,226, approximately $234 per square foot. 721 W 3rd North St is a home located in Hamblen County with nearby schools including West Elementary School, Lincoln Heights Middle School, and Morristown West High School.
Ownership History
Date
Name
Owned For
Owner Type
Purchase Details
Closed on
Jan 24, 2022
Sold by
Karen Nava
Bought by
Hive Properties Llc
Current Estimated Value
Home Financials for this Owner
Home Financials are based on the most recent Mortgage that was taken out on this home.
Original Mortgage
$136,850
Outstanding Balance
$117,873
Interest Rate
3.22%
Mortgage Type
New Conventional
Estimated Equity
$121,353
Purchase Details
Closed on
Apr 9, 2017
Sold by
Range Linda W
Bought by
Nava Karen
Home Financials for this Owner
Home Financials are based on the most recent Mortgage that was taken out on this home.
Original Mortgage
$59,850
Interest Rate
4.3%
Mortgage Type
New Conventional
Purchase Details
Closed on
Nov 8, 2007
Sold by
Range Randolph C
Bought by
Range Linda W
Purchase Details
Closed on
May 17, 1991
Bought by
Range Randolph C and Range Linda W
Purchase Details
Closed on
Jan 1, 1949
Bought by
Range Range R and Range Katherine
Create a Home Valuation Report for This Property
The Home Valuation Report is an in-depth analysis detailing your home's value as well as a comparison with similar homes in the area
Home Values in the Area
Average Home Value in this Area
Purchase History
| Date | Buyer | Sale Price | Title Company |
|---|---|---|---|
| Hive Properties Llc | $161,000 | None Listed On Document | |
| Nava Karen | $63,000 | -- | |
| Range Linda W | -- | -- | |
| Range Randolph C | $31,200 | -- | |
| Range Range R | -- | -- |
Source: Public Records
Mortgage History
| Date | Status | Borrower | Loan Amount |
|---|---|---|---|
| Open | Hive Properties Llc | $136,850 | |
| Previous Owner | Nava Karen | $59,850 |
Source: Public Records
Tax History Compared to Growth
Tax History
| Year | Tax Paid | Tax Assessment Tax Assessment Total Assessment is a certain percentage of the fair market value that is determined by local assessors to be the total taxable value of land and additions on the property. | Land | Improvement |
|---|---|---|---|---|
| 2024 | $359 | $20,425 | $6,225 | $14,200 |
| 2023 | $359 | $20,425 | $0 | $0 |
| 2022 | $645 | $20,425 | $6,225 | $14,200 |
| 2021 | $645 | $20,425 | $6,225 | $14,200 |
| 2020 | $644 | $20,425 | $6,225 | $14,200 |
| 2019 | $666 | $19,575 | $6,100 | $13,475 |
| 2018 | $617 | $19,575 | $6,100 | $13,475 |
| 2017 | $607 | $19,575 | $6,100 | $13,475 |
| 2016 | $580 | $19,575 | $6,100 | $13,475 |
| 2015 | $539 | $19,575 | $6,100 | $13,475 |
| 2014 | -- | $19,575 | $6,100 | $13,475 |
| 2013 | -- | $21,525 | $0 | $0 |
Source: Public Records
Map
Nearby Homes
- 722 W 2nd St N
- 816 W 2nd St N
- 529 N Jackson St
- 1002 Watercrest St
- 2078 Edgewater Sound Rd
- 0 Mcfarland St
- 912 N Church St
- 1211 W 6th St N
- 1011 Mcfarland St
- 118 E 3rd St N
- 1530 Rayburn Dr
- 837 Pauline Ave
- 1476 Darbee Dr
- 207 E 2nd St N
- 215 E 5th St N
- 323 Pauline Ave
- 311 E 4th St N
- 435 S Hill St
- 400 E 4th St N
- 1442 Darbee Dr
- 721 W 3rd St N
- 721 Third St N
- 709 W 3rd North St
- 728 W 2nd North St
- 722 W 2nd North St
- 710 W 2nd St N
- 705 W 3rd North St
- 710 W 2nd North St
- 737 W 3rd North St
- 737 W 3rd St N
- 701 W 3rd North St
- 740 W 2nd North St
- 702 W 2nd St N
- 702 W 2nd North St
- 710 W 3rd North St
- 0 W Third St N Unit 557142
- 702 W 3rd North St
- 805 W 3rd North St
- 717 W 2nd North St
- 725 W 2nd North St