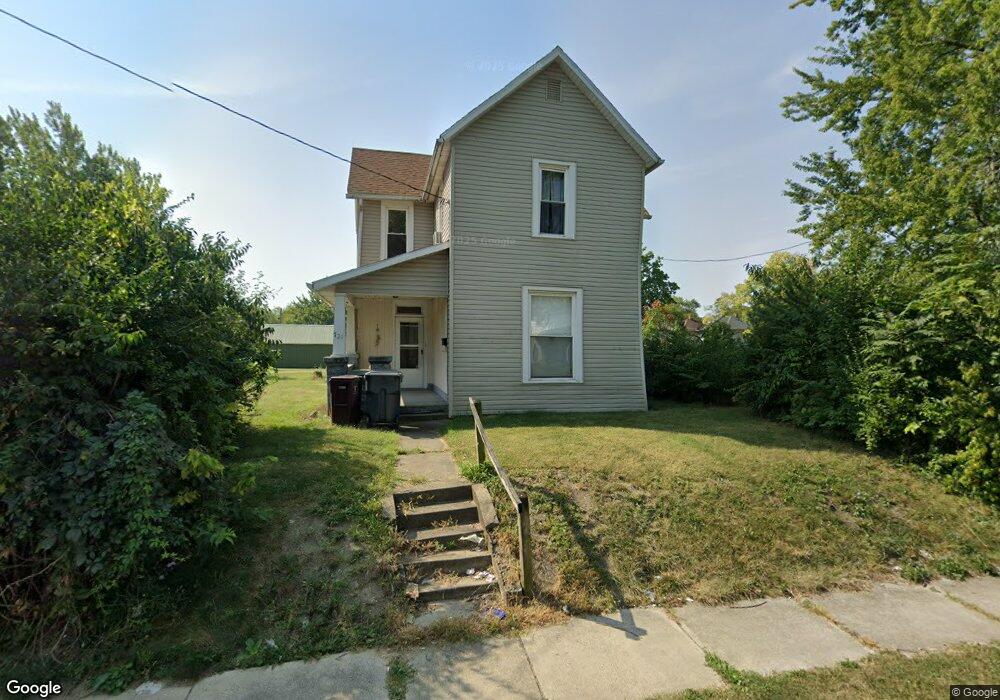
721 W Kibby St Lima, OH 45804
Fifth Ward NeighborhoodEstimated Value: $61,000 - $88,000
3
Beds
1
Bath
1,528
Sq Ft
$48/Sq Ft
Est. Value
About This Home
This home is located at 721 W Kibby St, Lima, OH 45804 and is currently estimated at $73,381, approximately $48 per square foot. 721 W Kibby St is a home located in Allen County with nearby schools including Unity Elementary School, Lima North Middle School, and Lima West Middle School.
Ownership History
Date
Name
Owned For
Owner Type
Purchase Details
Closed on
Nov 1, 2021
Bought by
David E Ball
Current Estimated Value
Purchase Details
Closed on
Jul 29, 2005
Sold by
Thompson Michael R and Thompson Sharon K
Bought by
Ball David E
Home Financials for this Owner
Home Financials are based on the most recent Mortgage that was taken out on this home.
Original Mortgage
$39,500
Interest Rate
8%
Mortgage Type
Adjustable Rate Mortgage/ARM
Purchase Details
Closed on
May 19, 1994
Sold by
Bailey Nelson J
Bought by
Thompson Michael R and Thompson Sharon K
Purchase Details
Closed on
Dec 10, 1992
Bought by
Bailey Nelson J
Create a Home Valuation Report for This Property
The Home Valuation Report is an in-depth analysis detailing your home's value as well as a comparison with similar homes in the area
Home Values in the Area
Average Home Value in this Area
Purchase History
| Date | Buyer | Sale Price | Title Company |
|---|---|---|---|
| David E Ball | -- | -- | |
| Ball David E | $39,500 | None Available | |
| Thompson Michael R | $7,000 | -- | |
| Bailey Nelson J | $6,000 | -- |
Source: Public Records
Mortgage History
| Date | Status | Borrower | Loan Amount |
|---|---|---|---|
| Previous Owner | Ball David E | $39,500 |
Source: Public Records
Tax History Compared to Growth
Tax History
| Year | Tax Paid | Tax Assessment Tax Assessment Total Assessment is a certain percentage of the fair market value that is determined by local assessors to be the total taxable value of land and additions on the property. | Land | Improvement |
|---|---|---|---|---|
| 2024 | $172 | $12,850 | $3,050 | $9,800 |
| 2023 | $158 | $11,480 | $2,730 | $8,750 |
| 2022 | $173 | $11,480 | $2,730 | $8,750 |
| 2021 | $153 | $10,820 | $2,070 | $8,750 |
| 2020 | $226 | $12,180 | $1,960 | $10,220 |
| 2019 | $226 | $12,180 | $1,960 | $10,220 |
| 2018 | $224 | $12,180 | $1,960 | $10,220 |
| 2017 | $227 | $12,180 | $1,960 | $10,220 |
| 2016 | $231 | $12,180 | $1,960 | $10,220 |
| 2015 | $146 | $12,180 | $1,960 | $10,220 |
| 2014 | $146 | $10,440 | $600 | $9,840 |
| 2013 | $144 | $10,440 | $600 | $9,840 |
Source: Public Records
Map
Nearby Homes
- 747 & 755 Oak St
- 785 Holly St
- 571 S Metcalf St
- 702 W Vine St
- 426 S Baxter St
- 419 S Collett St
- 411 S Collett St
- 725 W Elm St
- 343 S Charles St
- 128 E Kibby St
- 427 S Kenilworth Ave
- 227 S Cole St
- 12 Unit Multi Family and Sfh
- 526 S Pine St
- 306 E Vine St
- 233 S Kenilworth Ave
- 9 Unit Real Estate Package
- 839 Saint Johns Ave
- 1036 W High St
- 1147 S Union St