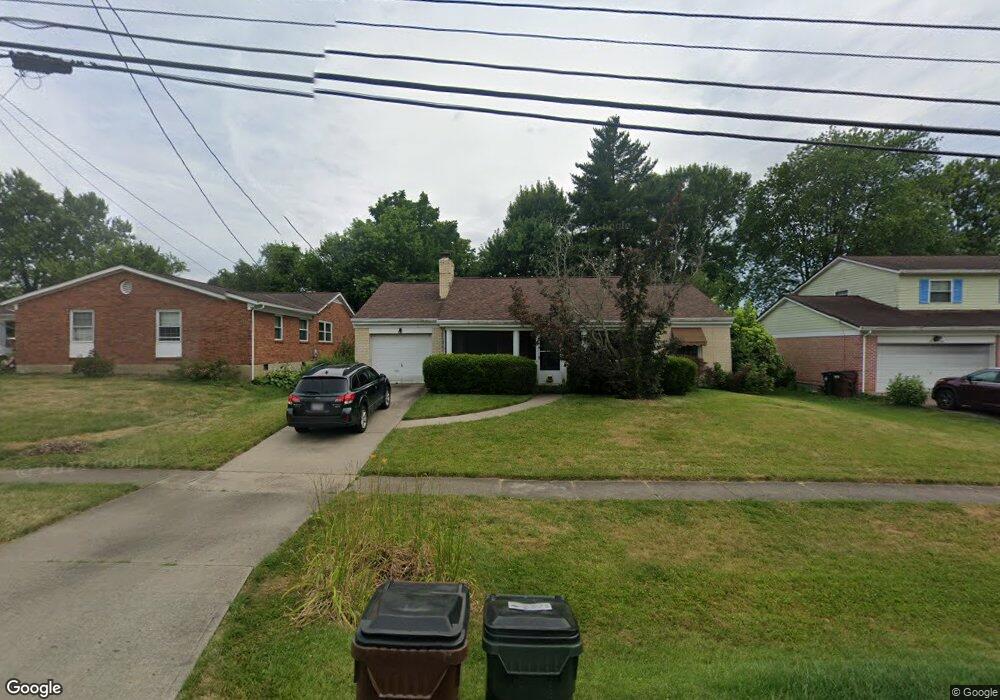
721 W Sharon Rd Cincinnati, OH 45240
Estimated Value: $196,000 - $249,000
3
Beds
2
Baths
1,308
Sq Ft
$161/Sq Ft
Est. Value
About This Home
This home is located at 721 W Sharon Rd, Cincinnati, OH 45240 and is currently estimated at $210,613, approximately $161 per square foot. 721 W Sharon Rd is a home located in Hamilton County with nearby schools including Calvary Academy- The and St Gabriel Consolidated School.
Ownership History
Date
Name
Owned For
Owner Type
Purchase Details
Closed on
Aug 24, 2007
Sold by
Lausche Louis F and Lausche Joanne H
Bought by
Odonnell Michael R and Odonnell Marcia M
Current Estimated Value
Home Financials for this Owner
Home Financials are based on the most recent Mortgage that was taken out on this home.
Original Mortgage
$98,400
Outstanding Balance
$61,852
Interest Rate
6.79%
Mortgage Type
Unknown
Estimated Equity
$148,761
Purchase Details
Closed on
Apr 25, 2006
Sold by
Collins Mavis W
Bought by
Lausche Louis F and Lausche Joanne H
Home Financials for this Owner
Home Financials are based on the most recent Mortgage that was taken out on this home.
Original Mortgage
$91,000
Interest Rate
6.42%
Mortgage Type
Unknown
Purchase Details
Closed on
May 6, 2002
Sold by
Estate Of Edsel Ford Collins
Bought by
Collins Mavis W
Create a Home Valuation Report for This Property
The Home Valuation Report is an in-depth analysis detailing your home's value as well as a comparison with similar homes in the area
Home Values in the Area
Average Home Value in this Area
Purchase History
| Date | Buyer | Sale Price | Title Company |
|---|---|---|---|
| Odonnell Michael R | $123,000 | Attorney | |
| Lausche Louis F | $91,000 | None Available | |
| Collins Mavis W | -- | -- |
Source: Public Records
Mortgage History
| Date | Status | Borrower | Loan Amount |
|---|---|---|---|
| Open | Odonnell Michael R | $98,400 | |
| Closed | Lausche Louis F | $91,000 |
Source: Public Records
Tax History
| Year | Tax Paid | Tax Assessment Tax Assessment Total Assessment is a certain percentage of the fair market value that is determined by local assessors to be the total taxable value of land and additions on the property. | Land | Improvement |
|---|---|---|---|---|
| 2025 | $2,442 | $51,703 | $9,944 | $41,759 |
| 2023 | $2,462 | $51,703 | $9,944 | $41,759 |
| 2022 | $2,176 | $37,223 | $8,845 | $28,378 |
| 2021 | $2,112 | $37,223 | $8,845 | $28,378 |
| 2020 | $2,156 | $37,223 | $8,845 | $28,378 |
| 2019 | $1,916 | $31,021 | $7,371 | $23,650 |
| 2018 | $1,921 | $31,021 | $7,371 | $23,650 |
| 2017 | $1,839 | $31,021 | $7,371 | $23,650 |
| 2016 | $1,712 | $29,176 | $7,777 | $21,399 |
| 2015 | $1,598 | $29,176 | $7,777 | $21,399 |
| 2014 | $1,475 | $29,176 | $7,777 | $21,399 |
| 2013 | $1,554 | $30,713 | $8,187 | $22,526 |
Source: Public Records
Map
Nearby Homes
- 602 Brightview Place Unit 34
- 612 Brightview Place Unit 30
- 614 Brightview Place Unit 29
- 626 Brightview Place Unit 24
- 622 Brightview Place Unit 26
- 620 Brightview Place Unit 27
- 624 Brightview Place Unit 25
- 564 Waycross Rd
- 16 Japonica Dr
- 38 Handel Ln
- 920 Waycross Rd
- 440 W Sharon Rd
- 483 Vista Glen Dr
- 37 Hayden Dr
- 11481 Fremantle Dr
- 162 Sheffield Rd
- 34 Gambier Cir
- 1013 Ligorio Ave
- 10483 Toulon Dr
- 31 Flanders Ln
- 727 W Sharon Rd
- 717 W Sharon Rd
- 720 Converse Dr
- 731 W Sharon Rd
- 711 W Sharon Rd
- 726 Converse Dr
- 712 Converse Dr
- 732 Converse Dr
- 706 Converse Dr
- 737 W Sharon Rd
- 705 W Sharon Rd
- 738 Converse Dr
- 726 W Sharon Rd
- 720 W Sharon Rd
- 700 Converse Dr
- 714 W Sharon Rd
- 730 W Sharon Rd
- 741 W Sharon Rd
- 708 W Sharon Rd
- 746 Converse Dr
Your Personal Tour Guide
Ask me questions while you tour the home.