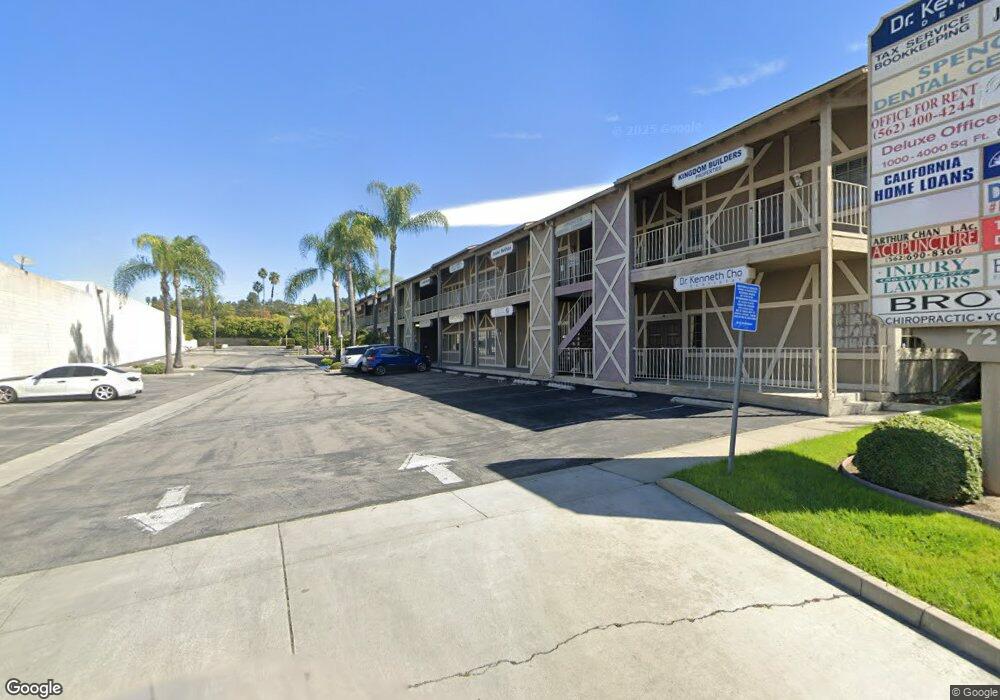
721 W Whittier Blvd Unit P La Habra, CA 90631
Estimated Value: $319,862
--
Bed
--
Bath
1,000
Sq Ft
$320/Sq Ft
Est. Value
About This Home
This home is located at 721 W Whittier Blvd Unit P, La Habra, CA 90631 and is currently estimated at $319,862, approximately $319 per square foot. 721 W Whittier Blvd Unit P is a home located in Orange County with nearby schools including El Cerrito Elementary School, Arbolita Elementary School, and Washington Middle School.
Ownership History
Date
Name
Owned For
Owner Type
Purchase Details
Closed on
May 24, 2018
Sold by
Ngo Phach T and Lam Kaline
Bought by
Ngo Phach T and Lam Kaline
Current Estimated Value
Purchase Details
Closed on
Mar 13, 2018
Sold by
Carcano Elaine
Bought by
Nco Phac T and Lam Kalne
Purchase Details
Closed on
Jul 19, 2017
Sold by
Carcano Carlos S and Carcano Elaine M
Bought by
Carcano Carlos S and Carcano Elaine
Purchase Details
Closed on
Jun 15, 2005
Sold by
Lu David and Cheung Yolanda
Bought by
Carcano Carlos S and Carcano Elaine M
Home Financials for this Owner
Home Financials are based on the most recent Mortgage that was taken out on this home.
Original Mortgage
$108,000
Interest Rate
5.65%
Mortgage Type
Commercial
Purchase Details
Closed on
Jul 29, 1994
Sold by
Pensworth Foreclosure Services Company
Bought by
Lu David and Cheung Yolanda
Create a Home Valuation Report for This Property
The Home Valuation Report is an in-depth analysis detailing your home's value as well as a comparison with similar homes in the area
Home Values in the Area
Average Home Value in this Area
Purchase History
| Date | Buyer | Sale Price | Title Company |
|---|---|---|---|
| Ngo Phach T | -- | Western Resoureces Title | |
| Nco Phac T | $200,000 | Western Resources Title | |
| Carcano Carlos S | -- | None Available | |
| Carcano Carlos S | $156,000 | Civic Center Title Services | |
| Lu David | $65,367 | South Coast Title |
Source: Public Records
Mortgage History
| Date | Status | Borrower | Loan Amount |
|---|---|---|---|
| Previous Owner | Carcano Carlos S | $108,000 |
Source: Public Records
Tax History Compared to Growth
Tax History
| Year | Tax Paid | Tax Assessment Tax Assessment Total Assessment is a certain percentage of the fair market value that is determined by local assessors to be the total taxable value of land and additions on the property. | Land | Improvement |
|---|---|---|---|---|
| 2025 | $2,515 | $227,563 | $159,296 | $68,267 |
| 2024 | $2,515 | $223,101 | $156,172 | $66,929 |
| 2023 | $2,458 | $218,727 | $153,110 | $65,617 |
| 2022 | $2,435 | $214,439 | $150,108 | $64,331 |
| 2021 | $2,395 | $210,235 | $147,165 | $63,070 |
| 2020 | $2,373 | $208,080 | $145,656 | $62,424 |
| 2019 | $2,305 | $204,000 | $142,800 | $61,200 |
| 2018 | $2,169 | $191,105 | $91,880 | $99,225 |
| 2017 | $2,130 | $187,358 | $90,078 | $97,280 |
| 2016 | $2,077 | $183,685 | $88,312 | $95,373 |
| 2015 | $2,017 | $180,926 | $86,985 | $93,941 |
| 2014 | $1,958 | $177,382 | $85,281 | $92,101 |
Source: Public Records
Map
Nearby Homes
- 320 -330 Monte Vista
- 581 W Greenwood Ave Unit 6
- 950 N Walnut St
- 501 Willow St
- 1020 La Serna Ave
- 1320 Marlei Rd
- 1421 Launer Dr
- 421 N Marian St
- 1100 N Euclid St
- 220 Olinda Ave
- 161 W Hidden Ln
- 720 W La Habra Blvd
- 401 Granada Dr
- 1230 Sunbird Ave
- 770 N Orange St
- 766 N Orange St
- 764 N Orange St
- 762 N Orange St
- 760 N Orange St
- Plan 4 - The Sage at The Birchwoods
- 721 W Whittier Blvd
- 721 W Whittier Blvd Unit R + S
- 721 W Whittier Blvd Unit STE O
- 721 W Whittier Blvd Unit Suite F
- 721 W Whittier Blvd Unit B
- 721 W Whittier Blvd Unit H
- 721 W Whittier Blvd Unit Q
- 721 W Whittier Blvd Unit G
- 721 W Whittier Blvd Unit N
- 721 W Whittier Blvd Unit I
- 721 W Whittier Blvd Unit J
- 721 W Whittier Blvd Unit F
- 721 W Whittier Blvd Unit D
- 721 W Whittier Blvd Unit L
- 721 W Whittier Blvd Unit K
- 721 W Whittier Blvd Unit C
- 721 W Whittier Blvd Unit M
- 721 W Whittier Blvd Unit R
- 721 W Whittier Blvd Unit S
- 721 W Whittier Blvd Unit E