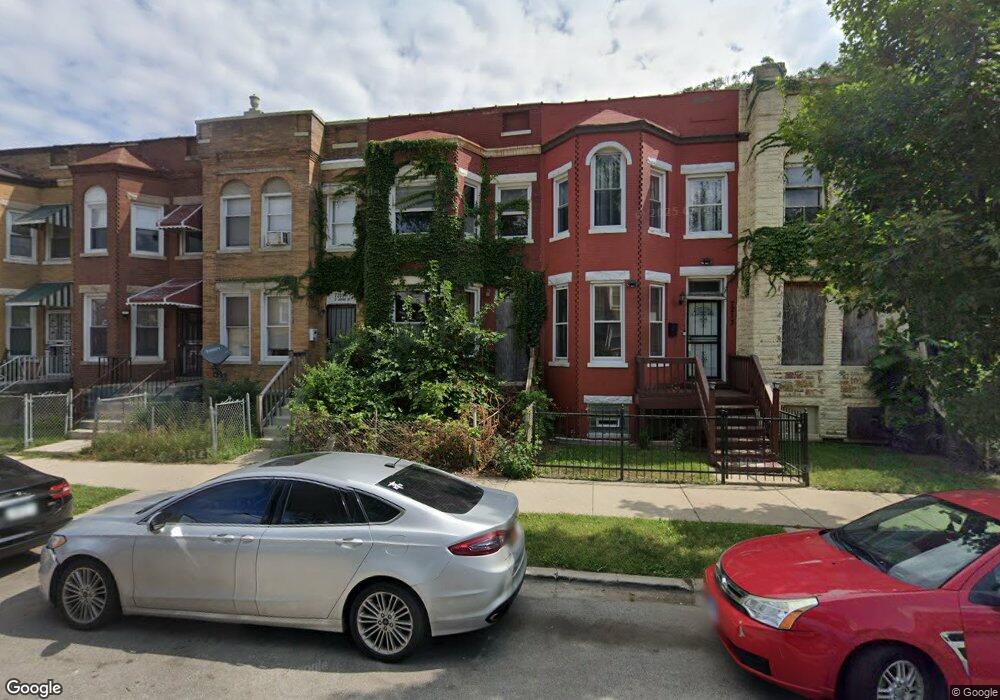
7211 S Saint Lawrence Ave Chicago, IL 60619
Park Manor NeighborhoodEstimated Value: $87,000 - $158,000
4
Beds
1
Bath
1,448
Sq Ft
$78/Sq Ft
Est. Value
About This Home
This home is located at 7211 S Saint Lawrence Ave, Chicago, IL 60619 and is currently estimated at $113,231, approximately $78 per square foot. 7211 S Saint Lawrence Ave is a home located in Cook County with nearby schools including Park Manor Elementary School, Gary Comer College Prep, and Augustus Tolton Catholic Academy.
Ownership History
Date
Name
Owned For
Owner Type
Purchase Details
Closed on
Apr 2, 2012
Sold by
Inc Ndp and Elmes Philip Elmes
Bought by
Ndp Affordable Homes Prototype 1
Current Estimated Value
Purchase Details
Closed on
Nov 4, 2011
Sold by
The Bank Of New York Mellon
Bought by
Ndp Inc
Purchase Details
Closed on
Jul 7, 2010
Sold by
Dorsey Henry and Dorsey Henry
Bought by
The Bank Of New York Mellon and The Bank Of New York
Purchase Details
Closed on
Jan 13, 2000
Sold by
Dorsey Dandelyn Davenport
Bought by
Dorsey Henry and Dorsey Dandelyn
Home Financials for this Owner
Home Financials are based on the most recent Mortgage that was taken out on this home.
Original Mortgage
$26,000
Interest Rate
13.2%
Purchase Details
Closed on
Feb 23, 1998
Sold by
Reed Claudette
Bought by
Dorsey Dandelyn
Purchase Details
Closed on
Jan 29, 1998
Sold by
Wallace Ruby Davenport
Bought by
Dorsey Dandelyn and Dorsey Henry
Create a Home Valuation Report for This Property
The Home Valuation Report is an in-depth analysis detailing your home's value as well as a comparison with similar homes in the area
Home Values in the Area
Average Home Value in this Area
Purchase History
| Date | Buyer | Sale Price | Title Company |
|---|---|---|---|
| Ndp Affordable Homes Prototype 1 | -- | None Available | |
| Ndp Inc | $10,000 | Cti | |
| The Bank Of New York Mellon | -- | None Available | |
| Dorsey Henry | -- | Intercounty Title | |
| Dorsey Dandelyn | -- | Intercounty Title | |
| Dorsey Dandelyn | -- | Intercounty Title | |
| Dorsey Dandelyn | -- | -- | |
| Dorsey Dandelyn | -- | Intercounty Title |
Source: Public Records
Mortgage History
| Date | Status | Borrower | Loan Amount |
|---|---|---|---|
| Previous Owner | Dorsey Henry | $26,000 |
Source: Public Records
Tax History Compared to Growth
Tax History
| Year | Tax Paid | Tax Assessment Tax Assessment Total Assessment is a certain percentage of the fair market value that is determined by local assessors to be the total taxable value of land and additions on the property. | Land | Improvement |
|---|---|---|---|---|
| 2024 | $1,371 | $8,400 | $1,771 | $6,629 |
| 2023 | $1,337 | $6,500 | $2,460 | $4,040 |
| 2022 | $1,337 | $6,500 | $2,460 | $4,040 |
| 2021 | $1,307 | $6,500 | $2,460 | $4,040 |
| 2020 | $2,477 | $11,120 | $2,460 | $8,660 |
| 2019 | $2,482 | $12,356 | $2,460 | $9,896 |
| 2018 | $2,441 | $12,356 | $2,460 | $9,896 |
| 2017 | $2,640 | $12,264 | $2,164 | $10,100 |
| 2016 | $2,456 | $12,264 | $2,164 | $10,100 |
| 2015 | $2,247 | $12,264 | $2,164 | $10,100 |
| 2014 | $2,106 | $11,352 | $1,771 | $9,581 |
| 2013 | $2,065 | $11,352 | $1,771 | $9,581 |
Source: Public Records
Map
Nearby Homes
- 7144 S Champlain Ave
- 7137 S Saint Lawrence Ave
- 7206 S Champlain Ave
- 7110 S Champlain Ave
- 7115 S Champlain Ave
- 7214 S Saint Lawrence Ave
- 706 E 72nd St
- 608 E 71st St
- 7225 S Langley Ave
- 7112 S Rhodes Ave
- 7220 S Rhodes Ave
- 7250 S Langley Ave
- 7157 S Eberhart Ave
- 7150 S Eberhart Ave
- 7148 S Eberhart Ave
- 7132 S Eberhart Ave
- 7245 S Evans Ave
- 7047 S Eberhart Ave
- 7042 S Eberhart Ave
- 7352 S Langley Ave
- 7209 1/2 S Saint Lawrence Ave
- 7215 S Saint Lawrence Ave
- 7209 S Saint Lawrence Ave
- 7209 S Saint Lawrence Ave
- 7213 S Saint Lawrence Ave
- 7213 S St Lawrence Ave
- 7213 S St Lawrence Ave
- 7217 S Saint Lawrence Ave
- 7207 S St Lawrence Ave
- 7207 S Saint Lawrence Ave
- 7207 S Saint Lawrence Ave
- 7219 S Saint Lawrence Ave
- 7219 S St Lawrence Ave Unit 7219
- 7207 S Saint Lawrence Ave
- 7207 S Saint Lawrence Ave
- 7221 S Saint Lawrence Ave
- 7205 S Saint Lawrence Ave
- 7223 S Saint Lawrence Ave
- 7203 S Saint Lawrence Ave
- 7225 S Saint Lawrence Ave