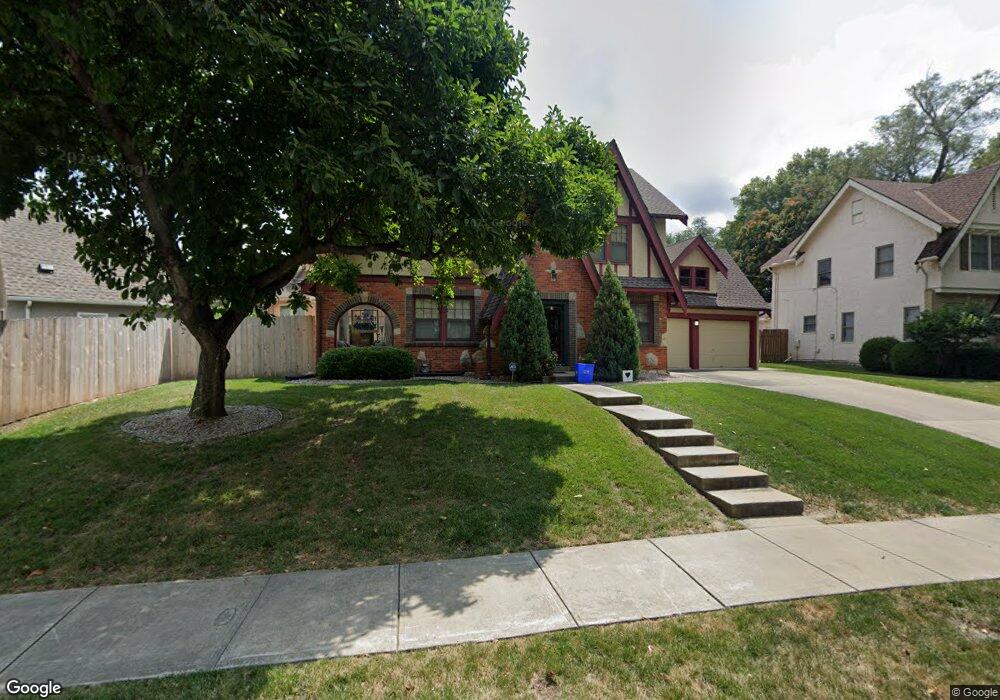
7211 Terrace St Kansas City, MO 64114
Waldo NeighborhoodEstimated Value: $428,000 - $541,000
3
Beds
2
Baths
1,746
Sq Ft
$264/Sq Ft
Est. Value
About This Home
This home is located at 7211 Terrace St, Kansas City, MO 64114 and is currently estimated at $461,247, approximately $264 per square foot. 7211 Terrace St is a home located in Jackson County with nearby schools including Hale Cook Elementary, Central Middle School, and Southeast High School.
Ownership History
Date
Name
Owned For
Owner Type
Purchase Details
Closed on
Jun 7, 2013
Sold by
Bradt Sandra K
Bought by
Bradt Sandra K and Sandra Bradt Trust
Current Estimated Value
Home Financials for this Owner
Home Financials are based on the most recent Mortgage that was taken out on this home.
Original Mortgage
$85,000
Interest Rate
3.38%
Mortgage Type
New Conventional
Purchase Details
Closed on
Mar 25, 2010
Sold by
Bradt Sandra K
Bought by
Bradt Sandra K and Sandra Bradt Trust
Home Financials for this Owner
Home Financials are based on the most recent Mortgage that was taken out on this home.
Original Mortgage
$78,700
Interest Rate
4.93%
Mortgage Type
New Conventional
Purchase Details
Closed on
Aug 8, 2007
Sold by
Bradt Sandra K
Bought by
Bradt Sandra K and Sandra Bradt Trust
Purchase Details
Closed on
Mar 11, 2002
Sold by
Bradt Clinton C
Bought by
Bradt Sandra K
Create a Home Valuation Report for This Property
The Home Valuation Report is an in-depth analysis detailing your home's value as well as a comparison with similar homes in the area
Home Values in the Area
Average Home Value in this Area
Purchase History
| Date | Buyer | Sale Price | Title Company |
|---|---|---|---|
| Bradt Sandra K | -- | Platinum Title Llc | |
| Bradt Sandra K | -- | Platinum Title Llc | |
| Bradt Sandra K | -- | Continental Title Co | |
| Bradt Sandra K | -- | Ctc | |
| Bradt Sandra K | -- | None Available | |
| Bradt Sandra K | -- | -- |
Source: Public Records
Mortgage History
| Date | Status | Borrower | Loan Amount |
|---|---|---|---|
| Closed | Bradt Sandra K | $85,000 | |
| Closed | Bradt Sandra K | $78,700 |
Source: Public Records
Tax History Compared to Growth
Tax History
| Year | Tax Paid | Tax Assessment Tax Assessment Total Assessment is a certain percentage of the fair market value that is determined by local assessors to be the total taxable value of land and additions on the property. | Land | Improvement |
|---|---|---|---|---|
| 2025 | $4,874 | $63,785 | $22,070 | $41,715 |
| 2024 | $4,828 | $61,750 | $20,797 | $40,953 |
| 2023 | $4,828 | $61,750 | $20,797 | $40,953 |
| 2022 | $4,907 | $59,660 | $25,120 | $34,540 |
| 2021 | $4,891 | $59,660 | $25,120 | $34,540 |
| 2020 | $4,338 | $52,250 | $25,120 | $27,130 |
| 2019 | $4,833 | $59,456 | $25,120 | $34,336 |
| 2018 | $3,468 | $43,573 | $9,237 | $34,336 |
| 2017 | $3,468 | $43,573 | $9,237 | $34,336 |
| 2016 | $3,215 | $40,161 | $10,605 | $29,556 |
| 2014 | $3,161 | $39,374 | $10,397 | $28,977 |
Source: Public Records
Map
Nearby Homes
- 7251 Terrace St
- 1245 W 72nd St
- 1296 W 72nd Terrace
- 7217 Madison Ave
- 2004 W 72nd Terrace
- 7416 Belleview Ave
- 701 W Gregory Blvd
- 7135 Jefferson St
- 2207 W 71st St
- 826 W 75th St
- 1012 W 69th Terrace
- 1911 Romany Rd
- 2300 W 71st Terrace
- 7305 Washington St
- 7615 Terrace St
- 707 W 75th Terrace
- 7515 Jefferson St
- 1127 W 76th Terrace
- 704 W 76th St
- 7216 Booth St
- 7217 Terrace St
- 7216 Ward Pkwy
- 7220 Ward Pkwy
- 7221 Terrace St
- 7208 Terrace St
- 7200 Ward Pkwy
- 7216 Terrace St
- 7225 Terrace St
- 7200 Terrace St
- 7228 Ward Pkwy
- 7220 Terrace St
- 1215 W 72nd St
- 7229 Terrace St
- 7232 Ward Pkwy
- 7224 Terrace St
- 7233 Terrace St
- 1221 W 72nd St
- 1221 W 72 St
- 1204 W 72nd St
- 1225 W 72nd St