Estimated Value: $1,300,526 - $1,728,000
3
Beds
2
Baths
2,166
Sq Ft
$693/Sq Ft
Est. Value
About This Home
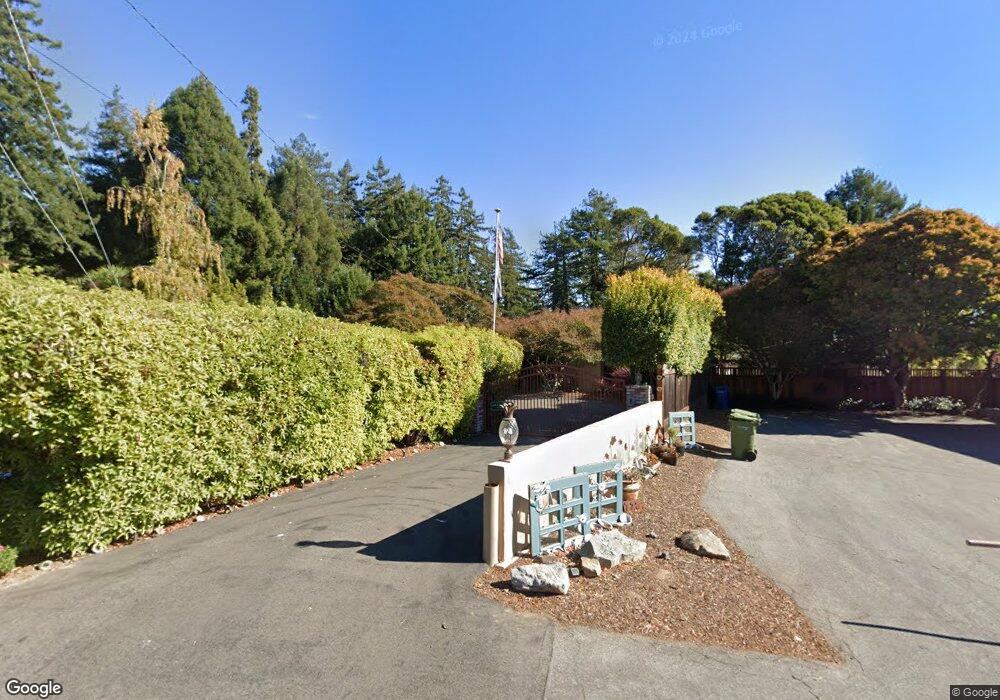
This home is located at 7211 Viewpoint Rd, Aptos, CA 95003 and is currently estimated at $1,500,132, approximately $692 per square foot. 7211 Viewpoint Rd is a home located in Santa Cruz County with nearby schools including Mar Vista Elementary School, Aptos Junior High School, and Aptos High School.
Ownership History
Date
Name
Owned For
Owner Type
Purchase Details
Closed on
Jul 15, 2022
Sold by
Hocom Dean B and Hocom Jayne E
Bought by
Hocom Family Trust and Hocom
Current Estimated Value
Purchase Details
Closed on
Mar 23, 2017
Sold by
Hocom Dean B and Hocom Jayne E
Bought by
Hocom Dean Brian and Hocom Jayne Ellen
Home Financials for this Owner
Home Financials are based on the most recent Mortgage that was taken out on this home.
Original Mortgage
$740,587
Interest Rate
4.15%
Mortgage Type
VA
Purchase Details
Closed on
Apr 8, 1998
Sold by
Hocum Dean B and Hocum Jayne E
Bought by
Hocom Dean B and Hocom Jaybe E
Home Financials for this Owner
Home Financials are based on the most recent Mortgage that was taken out on this home.
Original Mortgage
$198,000
Interest Rate
7.18%
Create a Home Valuation Report for This Property
The Home Valuation Report is an in-depth analysis detailing your home's value as well as a comparison with similar homes in the area
Home Values in the Area
Average Home Value in this Area
Purchase History
| Date | Buyer | Sale Price | Title Company |
|---|---|---|---|
| Hocom Family Trust | -- | None Listed On Document | |
| Hocom Dean B | -- | None Listed On Document | |
| Hocom Dean Brian | -- | North American Title | |
| Hocom Dean B | -- | Santa Cruz Title Company |
Source: Public Records
Mortgage History
| Date | Status | Borrower | Loan Amount |
|---|---|---|---|
| Previous Owner | Hocom Dean Brian | $740,587 | |
| Previous Owner | Hocom Dean B | $198,000 |
Source: Public Records
Tax History
| Year | Tax Paid | Tax Assessment Tax Assessment Total Assessment is a certain percentage of the fair market value that is determined by local assessors to be the total taxable value of land and additions on the property. | Land | Improvement |
|---|---|---|---|---|
| 2025 | $1,640 | $107,496 | $21,999 | $85,497 |
| 2023 | $1,607 | $103,321 | $21,144 | $82,177 |
| 2022 | $1,572 | $101,295 | $20,730 | $80,565 |
| 2021 | $1,418 | $99,309 | $20,323 | $78,986 |
| 2020 | $1,402 | $98,291 | $20,115 | $78,176 |
| 2019 | $1,383 | $96,363 | $19,720 | $76,643 |
| 2018 | $1,179 | $78,102 | $19,334 | $58,768 |
| 2017 | $1,171 | $76,571 | $18,955 | $57,616 |
| 2016 | $1,149 | $75,069 | $18,583 | $56,486 |
Source: Public Records
Map
Nearby Homes
- 2979 Mar Vista Dr Unit 102
- 2831 Casa de Vida Dr
- 49 Greco St Unit 49
- 2711 Mar Vista Dr Unit 15
- 522 Spruce St
- 836 Seacliff Dr
- 501 Pine St
- 601 Burns Ave
- 423 Hillcrest Dr
- 6247 Cabot Ct
- 716 Seacliff Dr
- 532 Moonrise Ln
- 2921 Crocker Ct
- 3069 Arlington Dr
- 3015 Arlington Dr
- 000 Burns Ave
- 111 Aptos Village Way Unit 4
- 111 Aptos Village Way Unit 1
- Lot 02 Cathedral Dr
- 101 Aptos Village Way Unit 4
- 7199 Viewpoint Rd
- 7221 Viewpoint Rd
- 7251 Viewpoint Rd
- 7179 Viewpoint Rd
- 7206 Viewpoint Rd
- 7200 Viewpoint Rd
- 7255 Viewpoint Rd
- 7210 Viewpoint Rd
- 7180 Viewpoint Rd
- 7285 Viewpoint Rd
- 7218 Viewpoint Rd
- 7250 Viewpoint Rd
- 7158 Viewpoint Rd
- 7224 Viewpoint Rd
- 7230 Viewpoint Rd
- 7175 Viewpoint Rd
- 7148 Viewpoint Rd
- 130 Ventana Ct
- 140 Ventana Ct
- 7262 Viewpoint Rd
Your Personal Tour Guide
Ask me questions while you tour the home.