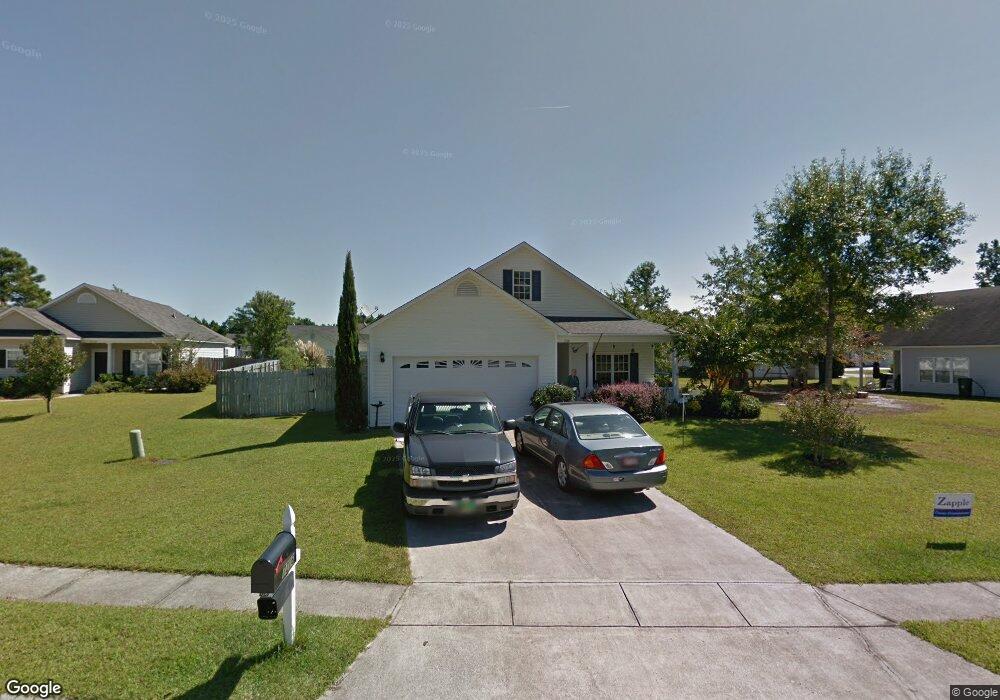
7216 Sherbon Way Wilmington, NC 28411
Estimated Value: $351,000 - $368,000
3
Beds
2
Baths
1,420
Sq Ft
$252/Sq Ft
Est. Value
About This Home
This home is located at 7216 Sherbon Way, Wilmington, NC 28411 and is currently estimated at $358,173, approximately $252 per square foot. 7216 Sherbon Way is a home located in New Hanover County with nearby schools including John J. Blair Elementary School, Emma B. Trask Middle School, and Emsley A. Laney High School.
Ownership History
Date
Name
Owned For
Owner Type
Purchase Details
Closed on
Oct 27, 2006
Sold by
Wozniak Robert J and Wozniak Kimberly H
Bought by
Starke William S
Current Estimated Value
Home Financials for this Owner
Home Financials are based on the most recent Mortgage that was taken out on this home.
Original Mortgage
$145,500
Outstanding Balance
$86,486
Interest Rate
6.39%
Mortgage Type
Purchase Money Mortgage
Estimated Equity
$271,687
Purchase Details
Closed on
Sep 29, 2004
Sold by
Leimone Charles P Meredith S
Bought by
Wozniak Robert J Sr Kimberley
Purchase Details
Closed on
Mar 15, 2002
Sold by
Sunrise Homes Inc
Bought by
Leimone Charles P Meredith S
Purchase Details
Closed on
Oct 28, 1999
Sold by
Farrington Farms Develop Corp
Bought by
Sunrise Homes Inc
Purchase Details
Closed on
Oct 21, 1996
Sold by
Craven W Allen Gwen L
Bought by
Farrington Farms Develop Corp
Purchase Details
Closed on
Nov 14, 1995
Sold by
Gts Development Llc
Bought by
Farrington Farms Develop Corp
Create a Home Valuation Report for This Property
The Home Valuation Report is an in-depth analysis detailing your home's value as well as a comparison with similar homes in the area
Home Values in the Area
Average Home Value in this Area
Purchase History
| Date | Buyer | Sale Price | Title Company |
|---|---|---|---|
| Starke William S | $194,000 | None Available | |
| Wozniak Robert J Sr Kimberley | $139,000 | -- | |
| Leimone Charles P Meredith S | $130,000 | -- | |
| Sunrise Homes Inc | $822,500 | -- | |
| Farrington Farms Develop Corp | $165,000 | -- | |
| Farrington Farms Develop Corp | -- | -- |
Source: Public Records
Mortgage History
| Date | Status | Borrower | Loan Amount |
|---|---|---|---|
| Open | Starke William S | $145,500 |
Source: Public Records
Tax History Compared to Growth
Tax History
| Year | Tax Paid | Tax Assessment Tax Assessment Total Assessment is a certain percentage of the fair market value that is determined by local assessors to be the total taxable value of land and additions on the property. | Land | Improvement |
|---|---|---|---|---|
| 2025 | $1,357 | $360,300 | $114,100 | $246,200 |
| 2023 | $1,357 | $245,600 | $63,100 | $182,500 |
| 2022 | $1,363 | $245,600 | $63,100 | $182,500 |
| 2021 | $1,357 | $245,600 | $63,100 | $182,500 |
| 2020 | $1,078 | $170,400 | $44,000 | $126,400 |
| 2019 | $1,078 | $170,400 | $44,000 | $126,400 |
| 2018 | $1,078 | $170,400 | $44,000 | $126,400 |
| 2017 | $1,103 | $170,400 | $44,000 | $126,400 |
| 2016 | $1,084 | $156,400 | $42,000 | $114,400 |
| 2015 | $1,007 | $156,400 | $42,000 | $114,400 |
| 2014 | $990 | $156,400 | $42,000 | $114,400 |
Source: Public Records
Map
Nearby Homes
- 209 Olde Well Loop Rd
- 2607 Bradfield Ct
- 1911 Daniel Boone Trail
- 6331 Gordon Rd
- 1915 Daniel Boone Trail
- 1907 Daniel Boone Trail
- 2400 Sunburst Ct
- 2213 White Rd
- 6329 Gordon Rd
- 2232 White Rd
- 7108 Thurgood Rd
- 2415 Sapling Cir
- 2408 Sapling Cir
- 2409 White Rd
- 2417 White Rd
- 802 Mayfield Ct
- 2305 Wildberry Ct
- 2431 White Rd
- 2309 Sunnyside Dr
- 545 Montego Ct
- 7218 Sherbon Way
- 6611 Wheatfields Ct
- 6609 Wheatfields Ct
- 7217 Farrington Farms Dr
- 7215 Farrington Farms Dr
- 7219 Farrington Farms Dr
- 7213 Farrington Farms Dr
- 7220 Sherbon Way
- 7219 Sherbon Way
- 7217 Sherbon Way
- 7221 Farrington Farms Dr
- 6605 Wheatfields Ct
- 7221 Sherbon Way
- 7222 Sherbon Way
- 7215 Sherbon Way
- 7223 Farrington Farms Dr
- 6614 Wheatfields Ct
- 6612 Wheatfields Ct
- 6616 Wheatfields Ct
- 6603 Wheatfields Ct