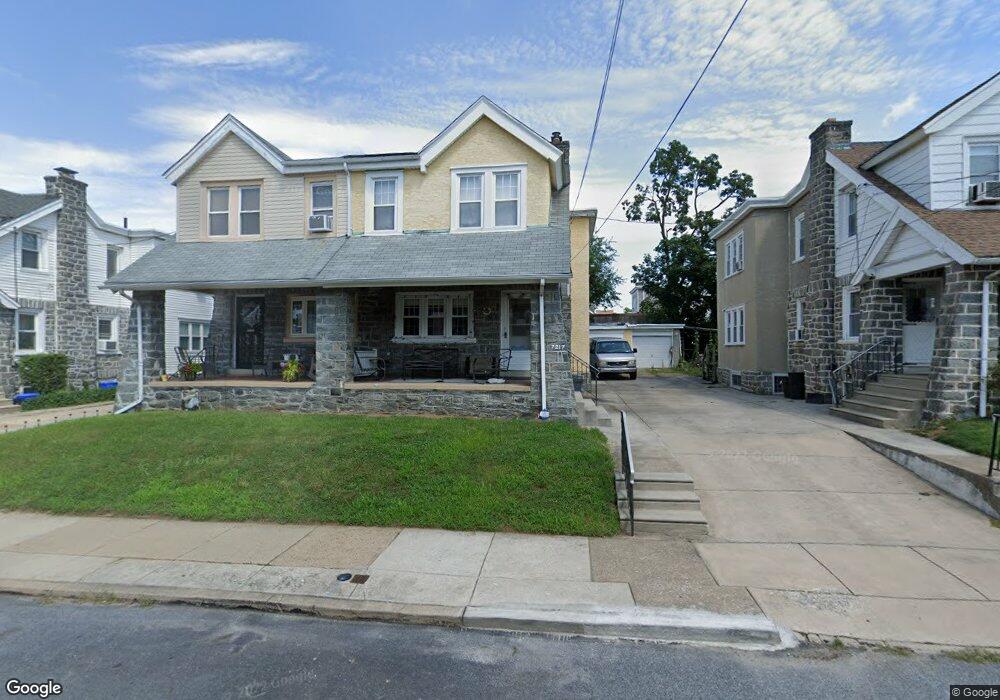
7217 Pine St Upper Darby, PA 19082
Estimated Value: $161,000 - $235,000
3
Beds
1
Bath
1,333
Sq Ft
$148/Sq Ft
Est. Value
About This Home
This home is located at 7217 Pine St, Upper Darby, PA 19082 and is currently estimated at $196,682, approximately $147 per square foot. 7217 Pine St is a home located in Delaware County with nearby schools including Bywood Elementary School, Upper Darby Kdg Center, and Upper Darby High School.
Ownership History
Date
Name
Owned For
Owner Type
Purchase Details
Closed on
Jun 20, 2023
Sold by
Macneal David H and Martucci Mariann C
Bought by
Jsp Real Estate Llc
Current Estimated Value
Home Financials for this Owner
Home Financials are based on the most recent Mortgage that was taken out on this home.
Original Mortgage
$166,500
Outstanding Balance
$162,363
Interest Rate
6.79%
Mortgage Type
Credit Line Revolving
Estimated Equity
$34,319
Purchase Details
Closed on
Sep 1, 1993
Sold by
Ingelsby Kathleen
Bought by
Macneal David H and Martucci Mariann C
Create a Home Valuation Report for This Property
The Home Valuation Report is an in-depth analysis detailing your home's value as well as a comparison with similar homes in the area
Home Values in the Area
Average Home Value in this Area
Purchase History
| Date | Buyer | Sale Price | Title Company |
|---|---|---|---|
| Jsp Real Estate Llc | $135,000 | None Listed On Document | |
| Macneal David H | $76,000 | -- |
Source: Public Records
Mortgage History
| Date | Status | Borrower | Loan Amount |
|---|---|---|---|
| Open | Jsp Real Estate Llc | $166,500 |
Source: Public Records
Tax History
| Year | Tax Paid | Tax Assessment Tax Assessment Total Assessment is a certain percentage of the fair market value that is determined by local assessors to be the total taxable value of land and additions on the property. | Land | Improvement |
|---|---|---|---|---|
| 2025 | $4,213 | $99,620 | $27,680 | $71,940 |
| 2024 | $4,213 | $99,620 | $27,680 | $71,940 |
| 2023 | $4,173 | $99,620 | $27,680 | $71,940 |
| 2022 | $4,061 | $99,620 | $27,680 | $71,940 |
| 2021 | $5,476 | $99,620 | $27,680 | $71,940 |
| 2020 | $4,443 | $68,680 | $21,530 | $47,150 |
| 2019 | $4,365 | $68,680 | $21,530 | $47,150 |
| 2018 | $4,314 | $68,680 | $0 | $0 |
| 2017 | $4,202 | $68,680 | $0 | $0 |
| 2016 | $385 | $68,680 | $0 | $0 |
| 2015 | $385 | $68,680 | $0 | $0 |
| 2014 | $385 | $68,680 | $0 | $0 |
Source: Public Records
Map
Nearby Homes
Your Personal Tour Guide
Ask me questions while you tour the home.