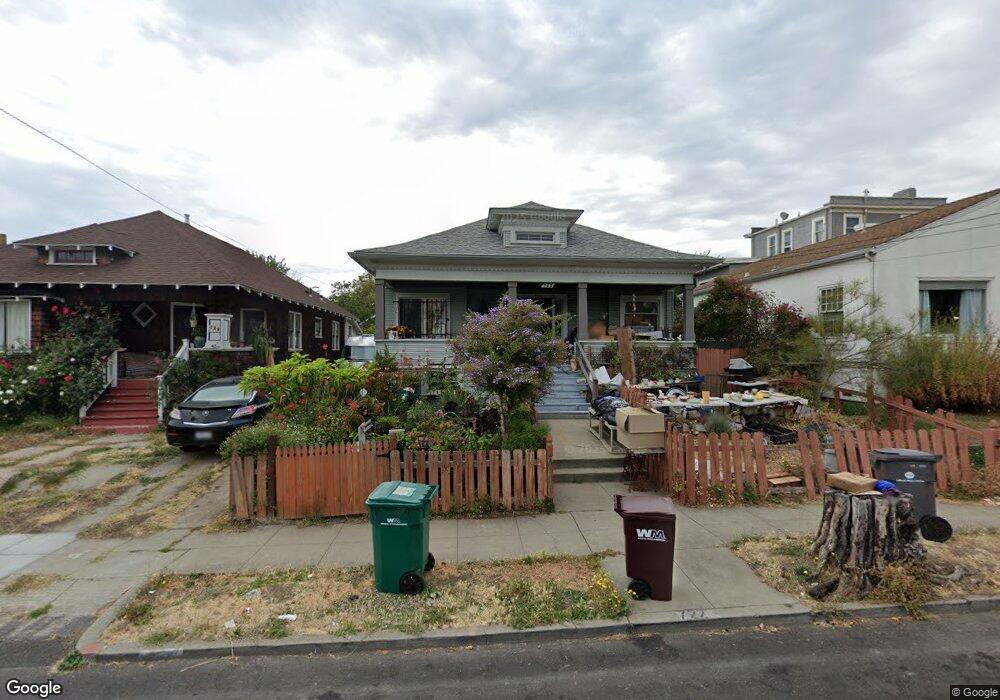
722 54th St Oakland, CA 94609
Santa Fe NeighborhoodEstimated Value: $731,364 - $1,244,000
2
Beds
2
Baths
1,488
Sq Ft
$637/Sq Ft
Est. Value
About This Home
This home is located at 722 54th St, Oakland, CA 94609 and is currently estimated at $948,341, approximately $637 per square foot. 722 54th St is a home located in Alameda County with nearby schools including Sankofa United Elementary School, Claremont Middle School, and Oakland Technical High School.
Ownership History
Date
Name
Owned For
Owner Type
Purchase Details
Closed on
Oct 3, 2023
Sold by
Morris Lawanda Alvette
Bought by
Framor Llc
Current Estimated Value
Purchase Details
Closed on
Aug 7, 2012
Sold by
Moss Vershon Marie and Versie Marie Ross Revocable Tr
Bought by
Morris Lawanda Alvette
Purchase Details
Closed on
Oct 31, 2011
Sold by
Ross Versie M and Versie M Ross 2001 Trust
Bought by
Ross Versie M and Versie M Ross Revocable Trust
Purchase Details
Closed on
Jul 13, 2001
Sold by
Ross Versie M
Bought by
Ross Versie M and The Versie Marie Ross 2001 Tru
Create a Home Valuation Report for This Property
The Home Valuation Report is an in-depth analysis detailing your home's value as well as a comparison with similar homes in the area
Home Values in the Area
Average Home Value in this Area
Purchase History
| Date | Buyer | Sale Price | Title Company |
|---|---|---|---|
| Framor Llc | -- | None Listed On Document | |
| Morris Lawanda Alvette | -- | None Available | |
| Ross Versie M | -- | None Available | |
| Ross Versie M | -- | -- |
Source: Public Records
Tax History
| Year | Tax Paid | Tax Assessment Tax Assessment Total Assessment is a certain percentage of the fair market value that is determined by local assessors to be the total taxable value of land and additions on the property. | Land | Improvement |
|---|---|---|---|---|
| 2025 | $2,996 | $44,131 | $27,950 | $16,181 |
| 2024 | $2,996 | $43,266 | $27,402 | $15,864 |
| 2023 | $2,957 | $42,418 | $26,865 | $15,553 |
| 2022 | $2,722 | $41,586 | $26,338 | $15,248 |
| 2021 | $2,364 | $40,771 | $25,822 | $14,949 |
| 2020 | $2,332 | $40,353 | $25,557 | $14,796 |
| 2019 | $2,092 | $39,562 | $25,056 | $14,506 |
| 2018 | $2,050 | $38,786 | $24,565 | $14,221 |
| 2017 | $1,911 | $38,026 | $24,083 | $13,943 |
| 2016 | $1,751 | $37,280 | $23,611 | $13,669 |
| 2015 | $1,734 | $36,720 | $23,256 | $13,464 |
| 2014 | $1,662 | $36,001 | $22,801 | $13,200 |
Source: Public Records
Map
Nearby Homes
Your Personal Tour Guide
Ask me questions while you tour the home.