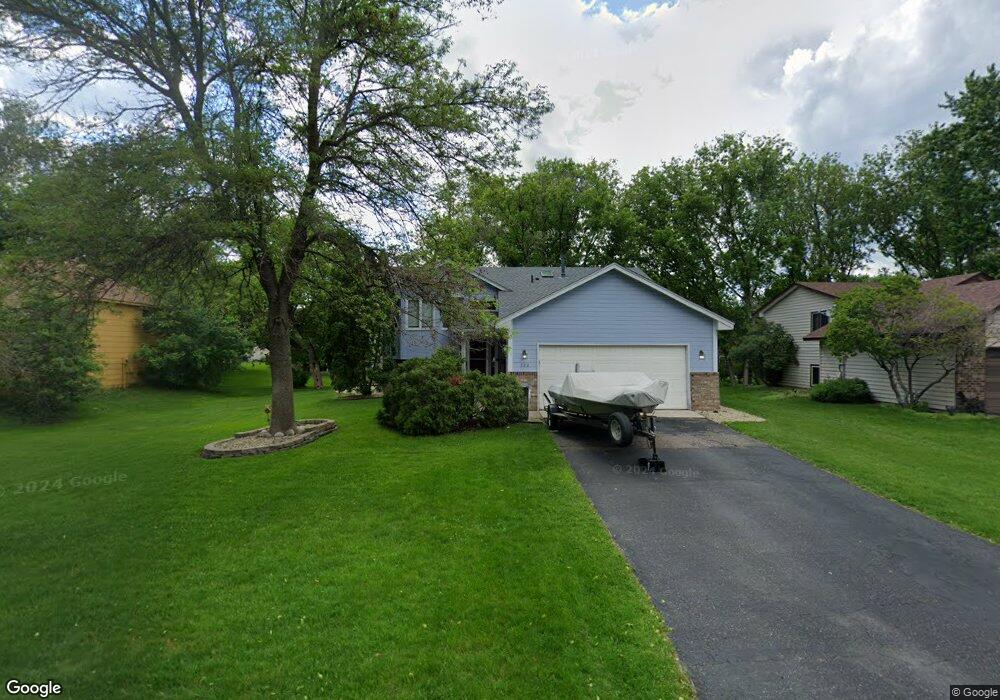
722 99th Cir NE Minneapolis, MN 55434
Estimated Value: $367,000 - $400,002
3
Beds
2
Baths
1,040
Sq Ft
$374/Sq Ft
Est. Value
About This Home
This home is located at 722 99th Cir NE, Minneapolis, MN 55434 and is currently estimated at $388,751, approximately $373 per square foot. 722 99th Cir NE is a home located in Anoka County with nearby schools including Northpoint Elementary School, Westwood Intermediate and Middle School, and Paladin Career & Technical High School.
Ownership History
Date
Name
Owned For
Owner Type
Purchase Details
Closed on
Mar 19, 2021
Sold by
Dettling Paul
Bought by
Scherer Andrea
Current Estimated Value
Purchase Details
Closed on
Jul 23, 2018
Sold by
Scherer Andrea
Bought by
Scherer Andrea and Dettling Paul
Home Financials for this Owner
Home Financials are based on the most recent Mortgage that was taken out on this home.
Original Mortgage
$250,635
Interest Rate
4.6%
Mortgage Type
New Conventional
Purchase Details
Closed on
Jun 29, 2018
Sold by
Abdillahi Hassan Y and Mohamed Fawzia
Bought by
Scherer Andrea
Home Financials for this Owner
Home Financials are based on the most recent Mortgage that was taken out on this home.
Original Mortgage
$250,635
Interest Rate
4.6%
Mortgage Type
New Conventional
Purchase Details
Closed on
Aug 26, 2004
Sold by
Bechard Brian L and Bechard Sarah M
Bought by
Abdillahi Hassen and Mohamed Fawzia
Purchase Details
Closed on
Nov 29, 1999
Sold by
Mcgauley Kevin D and Mcgauley Carri
Bought by
Bechard Brian and Bechard Sarah
Create a Home Valuation Report for This Property
The Home Valuation Report is an in-depth analysis detailing your home's value as well as a comparison with similar homes in the area
Home Values in the Area
Average Home Value in this Area
Purchase History
| Date | Buyer | Sale Price | Title Company |
|---|---|---|---|
| Scherer Andrea | -- | Titlesmart | |
| Scherer Andrea | -- | Partners Title Llc | |
| Scherer Andrea | $269,500 | None Available | |
| Abdillahi Hassen | $235,000 | -- | |
| Bechard Brian | $155,500 | -- |
Source: Public Records
Mortgage History
| Date | Status | Borrower | Loan Amount |
|---|---|---|---|
| Previous Owner | Scherer Andrea | $250,635 |
Source: Public Records
Tax History Compared to Growth
Tax History
| Year | Tax Paid | Tax Assessment Tax Assessment Total Assessment is a certain percentage of the fair market value that is determined by local assessors to be the total taxable value of land and additions on the property. | Land | Improvement |
|---|---|---|---|---|
| 2025 | $3,675 | $353,300 | $110,000 | $243,300 |
| 2024 | $3,675 | $342,200 | $108,200 | $234,000 |
| 2023 | $3,336 | $340,900 | $100,000 | $240,900 |
| 2022 | $3,172 | $336,700 | $86,400 | $250,300 |
| 2021 | $3,040 | $280,500 | $75,000 | $205,500 |
| 2020 | $3,090 | $265,100 | $73,000 | $192,100 |
| 2019 | $2,926 | $257,700 | $68,300 | $189,400 |
| 2018 | $2,865 | $239,400 | $0 | $0 |
| 2017 | $2,657 | $221,800 | $0 | $0 |
| 2016 | $2,569 | $194,000 | $0 | $0 |
| 2015 | -- | $194,000 | $55,500 | $138,500 |
| 2014 | -- | $165,500 | $45,000 | $120,500 |
Source: Public Records
Map
Nearby Homes
- 782 101st Ave NE
- 822 98th Ln NE
- 484 98th Ln NE
- 10252 Jackson St NE
- 914 98th Ave NE
- 583 97th Ln NE
- 10007 Tyler St NE
- 10022 Fillmore St NE Unit 72
- 9926 Fillmore St NE
- 877 96th Ave NE
- 1131 101st Ave NE Unit B
- 9624 Taylor St NE
- 10301 Fillmore Place
- 122 96th Ln NE
- 917 94th Ave NE
- 24 103rd Ave NW
- 10570 President Dr NE
- 9328 6th St NE
- 1348 104th Way
- 1312 104th Place NE
- 716 99th Cir NE
- 728 99th Cir NE
- 9929 Madison St NE
- 9917 Madison St NE
- 710 99th Cir NE
- 734 99th Cir NE
- 9941 Madison St NE
- 736 99th Ln NE
- 741 99th Cir NE
- 9905 Madison St NE
- 740 99th Cir NE
- 9951 Madison St NE
- 715 99th Ln NE
- 749 99th Cir NE
- 744 99th Ln NE
- 746 99th Cir NE
- 731 99th Ln NE
- 676 99th Ln NE
- 9970 Madison St NE
- 669 99th Ln NE