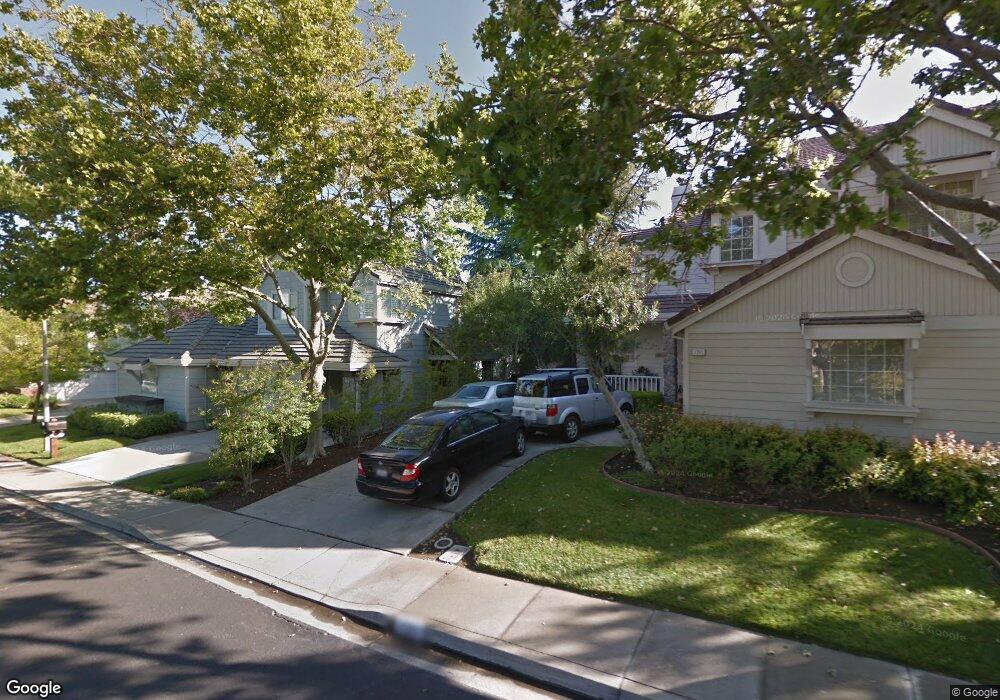
722 Anizumne Ct Unit 2 Clayton, CA 94517
Estimated Value: $824,844 - $1,043,000
3
Beds
3
Baths
1,749
Sq Ft
$512/Sq Ft
Est. Value
About This Home
This home is located at 722 Anizumne Ct Unit 2, Clayton, CA 94517 and is currently estimated at $895,961, approximately $512 per square foot. 722 Anizumne Ct Unit 2 is a home located in Contra Costa County with nearby schools including Mt. Diablo Elementary School, Diablo View Middle School, and College Park High School.
Ownership History
Date
Name
Owned For
Owner Type
Purchase Details
Closed on
Jul 31, 2025
Sold by
Heaney Daniel Joseph
Bought by
Heaney Living Trust and Heaney
Current Estimated Value
Purchase Details
Closed on
Jun 5, 2004
Sold by
Heaney Tanaz
Bought by
Heaney Daniel
Home Financials for this Owner
Home Financials are based on the most recent Mortgage that was taken out on this home.
Original Mortgage
$436,000
Interest Rate
3.25%
Mortgage Type
Purchase Money Mortgage
Purchase Details
Closed on
May 24, 2004
Sold by
Bingenheimer Randall L and Bingenheimer Sarah E
Bought by
Heaney Daniel
Home Financials for this Owner
Home Financials are based on the most recent Mortgage that was taken out on this home.
Original Mortgage
$436,000
Interest Rate
3.25%
Mortgage Type
Purchase Money Mortgage
Purchase Details
Closed on
Dec 19, 2001
Sold by
Bingenheimer Randall L and Bingenheimer Sarah E
Bought by
Bingenheimer Randall L and Bingenheimer Sarah E
Create a Home Valuation Report for This Property
The Home Valuation Report is an in-depth analysis detailing your home's value as well as a comparison with similar homes in the area
Home Values in the Area
Average Home Value in this Area
Purchase History
| Date | Buyer | Sale Price | Title Company |
|---|---|---|---|
| Heaney Living Trust | -- | None Listed On Document | |
| Heaney Daniel | -- | North American Title | |
| Heaney Daniel | $545,000 | North American Title | |
| Bingenheimer Randall L | -- | -- |
Source: Public Records
Mortgage History
| Date | Status | Borrower | Loan Amount |
|---|---|---|---|
| Previous Owner | Heaney Daniel | $436,000 |
Source: Public Records
Tax History Compared to Growth
Tax History
| Year | Tax Paid | Tax Assessment Tax Assessment Total Assessment is a certain percentage of the fair market value that is determined by local assessors to be the total taxable value of land and additions on the property. | Land | Improvement |
|---|---|---|---|---|
| 2025 | $9,663 | $774,857 | $383,874 | $390,983 |
| 2024 | $9,484 | $759,665 | $376,348 | $383,317 |
| 2023 | $9,484 | $744,770 | $368,969 | $375,801 |
| 2022 | $9,424 | $730,168 | $361,735 | $368,433 |
| 2021 | $9,245 | $715,852 | $354,643 | $361,209 |
| 2019 | $9,009 | $679,000 | $336,386 | $342,614 |
| 2018 | $8,500 | $649,000 | $321,523 | $327,477 |
| 2017 | $7,871 | $603,500 | $298,982 | $304,518 |
| 2016 | $7,377 | $565,000 | $279,908 | $285,092 |
| 2015 | $6,766 | $508,500 | $251,918 | $256,582 |
| 2014 | $6,672 | $500,000 | $247,707 | $252,293 |
Source: Public Records
Map
Nearby Homes
- 931 Arrowhead Terrace
- 1731 Indian Wells Way
- 337 Saclan Terrace
- 415 Chupcan Place Unit 3
- 814 Chert Place
- 1221 Buckeye Terrace
- 1039 Feather Cir
- 1816 Eagle Peak Ave
- 1343 Shell Ln
- 1338 Shell Ln
- 3902 Coyote Cir
- 1923 Eagle Peak Ave
- 5647 Southbrook Dr
- 4701 Keller Ridge Dr Unit 12
- 1829 Yolanda Cir
- 5516 Langford Ct
- 1290 Easley Dr
- 5900 High St
- 1835 Camino Estrada
- 8040 Kelok Way
- 720 Anizumne Ct
- 1727 Indian Wells Way
- 506 Suisun Ct
- 718 Anizumne Ct
- 508 Suisun Ct Unit Ct
- 508 Suisun Ct
- 1729 Indian Wells Way
- 1725 Indian Wells Way
- 504 Suisun Ct
- 1723 Indian Wells Way
- 716 Anizumne Ct
- 1721 Indian Wells Way
- 714 Anizumne Ct
- 502 Suisun Ct
- 510 Suisun Ct
- 710 Anizumne Ct
- 1719 Indian Wells Way
- 712 Anizumne Ct
- 708 Anizumne Ct
- 706 Anizumne Ct