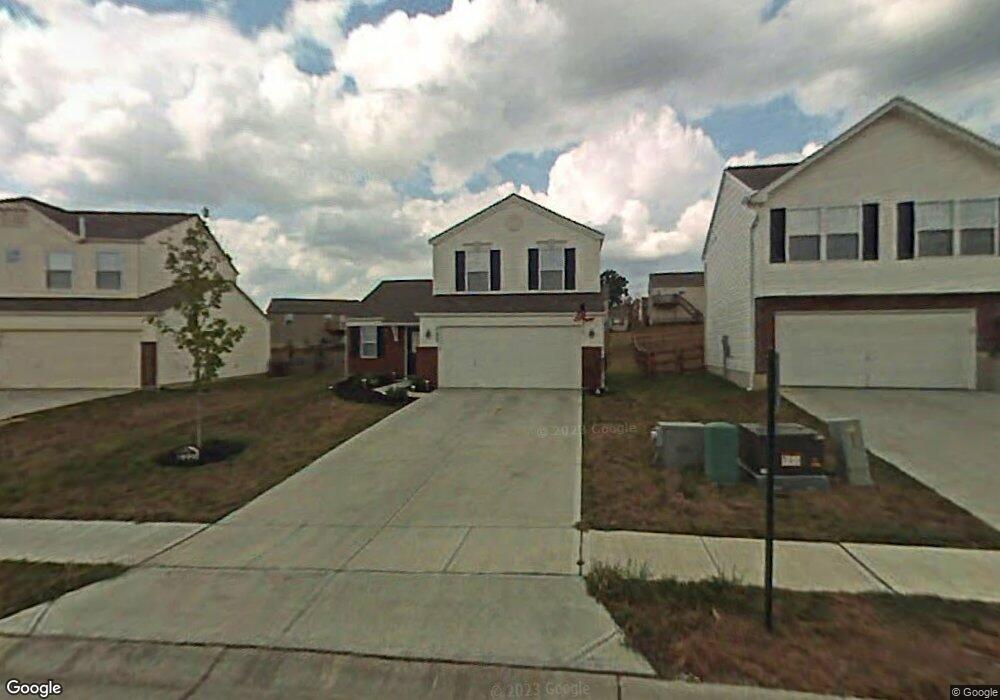
722 Berlander Dr Independence, KY 41051
Estimated Value: $263,000 - $281,000
3
Beds
3
Baths
1,344
Sq Ft
$203/Sq Ft
Est. Value
About This Home
This home is located at 722 Berlander Dr, Independence, KY 41051 and is currently estimated at $273,184, approximately $203 per square foot. 722 Berlander Dr is a home located in Kenton County with nearby schools including Beechgrove Elementary School, Twenhofel Middle School, and Simon Kenton High School.
Ownership History
Date
Name
Owned For
Owner Type
Purchase Details
Closed on
Oct 25, 2017
Sold by
Bondick Daniel Jacob and Bondick Heather
Bought by
Staton Shelby M
Current Estimated Value
Home Financials for this Owner
Home Financials are based on the most recent Mortgage that was taken out on this home.
Original Mortgage
$156,060
Outstanding Balance
$130,528
Interest Rate
3.78%
Mortgage Type
New Conventional
Estimated Equity
$142,656
Purchase Details
Closed on
Aug 22, 2006
Sold by
Maple Street Homes Llc
Bought by
Bondick Daniel Jacob
Home Financials for this Owner
Home Financials are based on the most recent Mortgage that was taken out on this home.
Original Mortgage
$67,535
Interest Rate
6.73%
Mortgage Type
Purchase Money Mortgage
Purchase Details
Closed on
Apr 25, 2006
Sold by
Glenhurst Development Llc
Bought by
Maple Street Homes Llc
Create a Home Valuation Report for This Property
The Home Valuation Report is an in-depth analysis detailing your home's value as well as a comparison with similar homes in the area
Home Values in the Area
Average Home Value in this Area
Purchase History
| Date | Buyer | Sale Price | Title Company |
|---|---|---|---|
| Staton Shelby M | $154,500 | 360 American Title Services | |
| Bondick Daniel Jacob | $137,535 | Homestead Title Agency Ltd | |
| Maple Street Homes Llc | $31,000 | None Available |
Source: Public Records
Mortgage History
| Date | Status | Borrower | Loan Amount |
|---|---|---|---|
| Open | Staton Shelby M | $156,060 | |
| Previous Owner | Bondick Daniel Jacob | $67,535 |
Source: Public Records
Tax History Compared to Growth
Tax History
| Year | Tax Paid | Tax Assessment Tax Assessment Total Assessment is a certain percentage of the fair market value that is determined by local assessors to be the total taxable value of land and additions on the property. | Land | Improvement |
|---|---|---|---|---|
| 2024 | $2,296 | $187,400 | $30,000 | $157,400 |
| 2023 | $2,365 | $187,400 | $30,000 | $157,400 |
| 2022 | $2,426 | $187,400 | $30,000 | $157,400 |
| 2021 | $2,462 | $187,400 | $30,000 | $157,400 |
| 2020 | $2,085 | $154,500 | $25,000 | $129,500 |
| 2019 | $2,091 | $154,500 | $25,000 | $129,500 |
| 2018 | $2,102 | $154,500 | $25,000 | $129,500 |
| 2017 | $1,828 | $137,500 | $25,000 | $112,500 |
| 2015 | $1,772 | $137,500 | $31,000 | $106,500 |
| 2014 | $1,748 | $137,500 | $31,000 | $106,500 |
Source: Public Records
Map
Nearby Homes
- 10720 Hanover Ct
- 660 Ackerly Dr
- 604 Astoria Ct
- 611 Berlander Dr
- 603 Branch Ct
- 586 Cutter Ln
- 622 Badger Ct
- 10470 Travis St
- 558 Tupelo Dr
- 10690 Melbury Ct Unit 305GL
- 10694 Melbury Ct Unit 306GL
- 10724 Melbury Ct Unit 287GL
- The Westchester Plan at The Greens of Glenhurst
- The Ella Marie Plan at The Greens of Glenhurst
- The Jefferson Plan at The Greens of Glenhurst
- The Leighann Plan at The Greens of Glenhurst
- The Waterson Plan at The Greens of Glenhurst
- The Lancaster Plan at The Greens of Glenhurst
- The Austin Plan at The Greens of Glenhurst
- The Morgan Plan at The Greens of Glenhurst
- 722 Berlander Dr Unit 330
- 726 Berlander Dr
- 718 Berlander Dr
- 718 Berlander Dr Unit 329
- 717 Ackerly Dr
- 721 Ackerly Dr
- 712 Berlander Dr
- 712 Berlander Dr Unit 328
- 713 Ackerly Dr
- 751 Ackerly Dr
- 747 Ackerly Dr
- 709 Ackerly Dr
- 743 Ackerly Dr
- 717 Berlander Dr
- 717 Berlander Dr Unit 333
- 739 Ackerly Dr
- 708 Berlander Dr
- 725 Berlander Dr
- 725 Berlander Dr Unit 332
- 761 Ackerly Dr