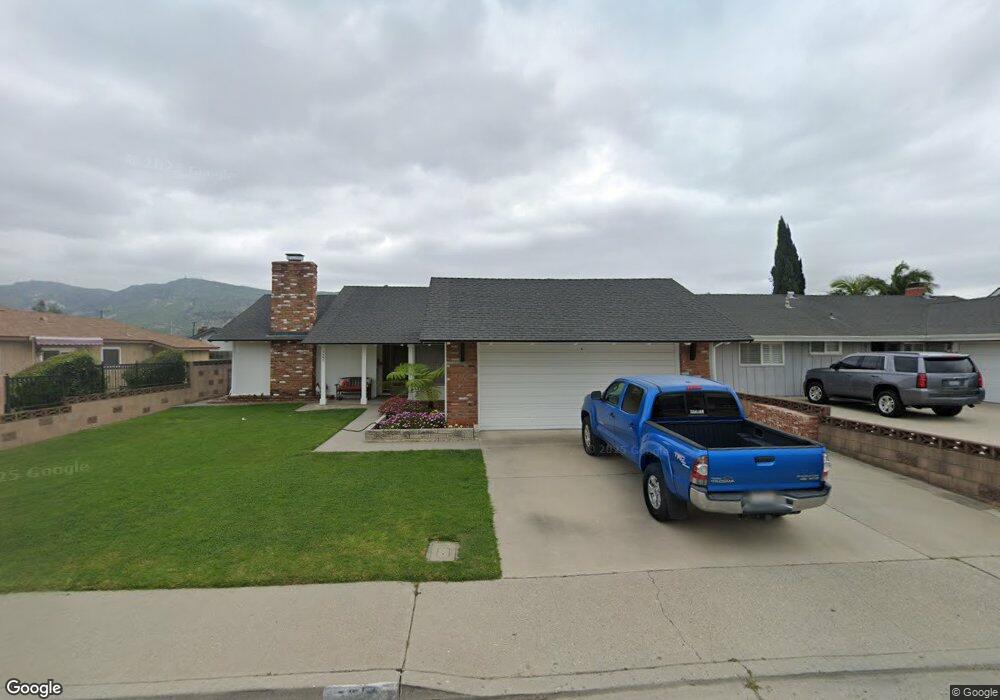
722 Center Ln Santa Paula, CA 93060
Estimated Value: $708,000 - $726,000
4
Beds
2
Baths
1,551
Sq Ft
$461/Sq Ft
Est. Value
About This Home
This home is located at 722 Center Ln, Santa Paula, CA 93060 and is currently estimated at $714,845, approximately $460 per square foot. 722 Center Ln is a home located in Ventura County with nearby schools including Blanchard Elementary School, Isbell Middle, and Santa Paula High.
Ownership History
Date
Name
Owned For
Owner Type
Purchase Details
Closed on
Oct 3, 2020
Sold by
Hobson Susanne C and Nichols Annette Carol
Bought by
Hobson Emily Faith
Current Estimated Value
Home Financials for this Owner
Home Financials are based on the most recent Mortgage that was taken out on this home.
Original Mortgage
$328,000
Outstanding Balance
$291,739
Interest Rate
2.9%
Mortgage Type
New Conventional
Estimated Equity
$423,107
Purchase Details
Closed on
Aug 31, 2020
Sold by
Hobson Susanne C and The Betty Lee Crisman 2015 Rev
Bought by
Hobson Susanne C and Nichols Annette Carol
Home Financials for this Owner
Home Financials are based on the most recent Mortgage that was taken out on this home.
Original Mortgage
$328,000
Outstanding Balance
$291,739
Interest Rate
2.9%
Mortgage Type
New Conventional
Estimated Equity
$423,107
Purchase Details
Closed on
Nov 13, 2015
Sold by
Crisman Betty Lee
Bought by
The Betty Lee Crisman 2015 Revocable Tru
Create a Home Valuation Report for This Property
The Home Valuation Report is an in-depth analysis detailing your home's value as well as a comparison with similar homes in the area
Home Values in the Area
Average Home Value in this Area
Purchase History
| Date | Buyer | Sale Price | Title Company |
|---|---|---|---|
| Hobson Emily Faith | $480,000 | Lawyers Title Company | |
| Hobson Susanne C | -- | None Available | |
| The Betty Lee Crisman 2015 Revocable Tru | -- | None Available |
Source: Public Records
Mortgage History
| Date | Status | Borrower | Loan Amount |
|---|---|---|---|
| Open | Hobson Emily Faith | $328,000 |
Source: Public Records
Tax History Compared to Growth
Tax History
| Year | Tax Paid | Tax Assessment Tax Assessment Total Assessment is a certain percentage of the fair market value that is determined by local assessors to be the total taxable value of land and additions on the property. | Land | Improvement |
|---|---|---|---|---|
| 2025 | $5,113 | $453,341 | $285,740 | $167,601 |
| 2024 | $5,113 | $444,452 | $280,137 | $164,315 |
| 2023 | $5,006 | $435,738 | $274,644 | $161,094 |
| 2022 | $4,859 | $427,195 | $269,259 | $157,936 |
| 2021 | $4,860 | $418,819 | $263,979 | $154,840 |
| 2020 | $734 | $63,783 | $16,759 | $47,024 |
| 2019 | $696 | $62,533 | $16,431 | $46,102 |
| 2018 | $687 | $61,308 | $16,109 | $45,199 |
| 2017 | $693 | $60,107 | $15,794 | $44,313 |
| 2016 | $653 | $58,930 | $15,485 | $43,445 |
| 2015 | $624 | $58,047 | $15,253 | $42,794 |
| 2014 | $633 | $56,911 | $14,955 | $41,956 |
Source: Public Records
Map
Nearby Homes
- 752 Fillmore St
- 747 Southwick St
- 605 Elfred Ct
- 0 Foothill Rd
- 545 W Santa Paula St
- 525 W Santa Barbara St
- 535 Ridgecrest Dr
- 612 Shasta Dr
- 428 Anacapa Terrace
- 362 W Santa Barbara St
- 324 W Santa Barbara St
- 975 W Telegraph Rd Unit 34
- 975 W Telegraph Rd Unit 126
- 975 W Telegraph Rd Unit 40
- 423 Atmore Dr
- 352 Moultrie Place
- 710 W Harvard Blvd Unit 46
- 342 Princeton St
- 265 S Beckwith Rd Unit 43A
- 265 S Beckwith Rd Unit 57
- 232 Walden St
- 728 Center Ln
- 717 W Santa Barbara St
- 220 Walden St
- 725 W Santa Barbara St
- 736 Center Ln
- 723 Center Ln
- 739 W Santa Barbara St
- 727 Center Ln
- 264 Walden St
- 740 Center Ln
- 733 Center Ln
- 231 Walden St
- 223 Walden St
- 745 W Santa Barbara St
- 251 Walden St
- 217 Walden St
- 745 Center Ln
- 750 Center Ln
- 255 Walden St