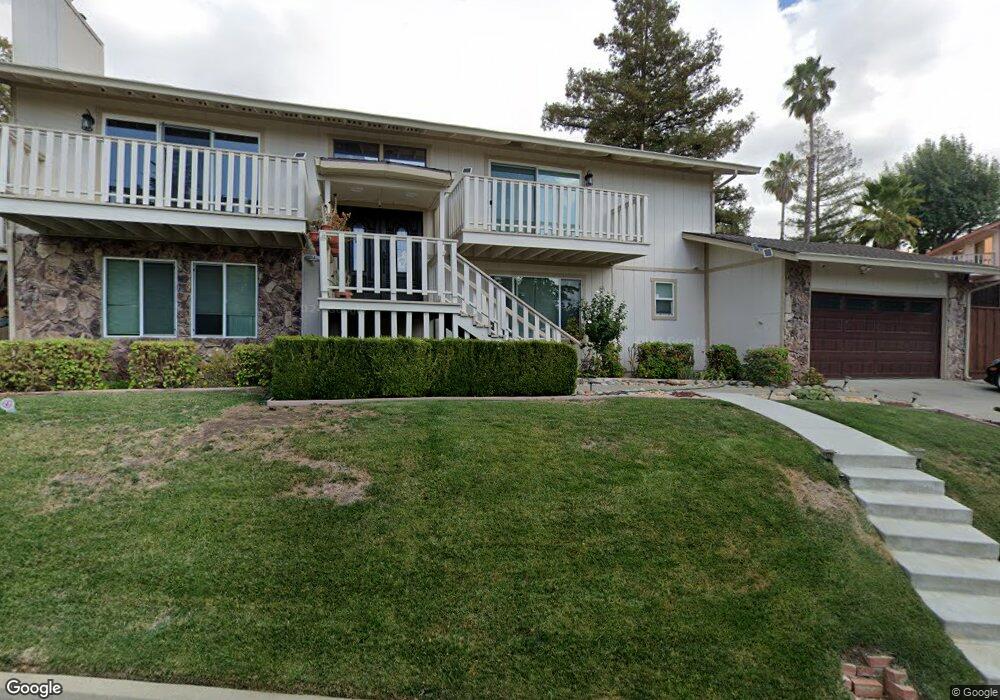
722 Daffodil Way Concord, CA 94518
Shadelands NeighborhoodEstimated Value: $1,099,286 - $1,284,000
5
Beds
3
Baths
2,275
Sq Ft
$513/Sq Ft
Est. Value
About This Home
This home is located at 722 Daffodil Way, Concord, CA 94518 and is currently estimated at $1,167,572, approximately $513 per square foot. 722 Daffodil Way is a home located in Contra Costa County with nearby schools including Woodside Elementary School, Oak Grove Middle School, and Ygnacio Valley High School.
Ownership History
Date
Name
Owned For
Owner Type
Purchase Details
Closed on
Apr 13, 2011
Sold by
Huston Michael J and Huston Peggy L
Bought by
Alalusi Zaid and Alalusi Hesham R
Current Estimated Value
Purchase Details
Closed on
Apr 6, 2011
Sold by
Alalusi Hesham R and Alalusi Diana L
Bought by
Alalusi Zaid and Rouhi Shawk S
Purchase Details
Closed on
Jan 16, 2008
Sold by
Wacek Donald R and Wacek Marta D
Bought by
Huston Michael J and Houston Peggy L
Home Financials for this Owner
Home Financials are based on the most recent Mortgage that was taken out on this home.
Original Mortgage
$594,400
Interest Rate
6.17%
Mortgage Type
Negative Amortization
Create a Home Valuation Report for This Property
The Home Valuation Report is an in-depth analysis detailing your home's value as well as a comparison with similar homes in the area
Home Values in the Area
Average Home Value in this Area
Purchase History
| Date | Buyer | Sale Price | Title Company |
|---|---|---|---|
| Alalusi Zaid | $385,000 | Chicago Title Company | |
| Alalusi Zaid | -- | Accommodation | |
| Alalusi Zaid | -- | Accommodation | |
| Alalusi Zaid | $385,000 | Chicago Title Company | |
| Huston Michael J | $743,000 | North American Title Company |
Source: Public Records
Mortgage History
| Date | Status | Borrower | Loan Amount |
|---|---|---|---|
| Previous Owner | Huston Michael J | $594,400 |
Source: Public Records
Tax History
| Year | Tax Paid | Tax Assessment Tax Assessment Total Assessment is a certain percentage of the fair market value that is determined by local assessors to be the total taxable value of land and additions on the property. | Land | Improvement |
|---|---|---|---|---|
| 2025 | $6,455 | $493,237 | $277,366 | $215,871 |
| 2024 | $6,162 | $483,567 | $271,928 | $211,639 |
| 2023 | $6,162 | $474,087 | $266,597 | $207,490 |
| 2022 | $6,073 | $464,792 | $261,370 | $203,422 |
| 2021 | $5,920 | $455,680 | $256,246 | $199,434 |
| 2019 | $5,804 | $442,167 | $248,647 | $193,520 |
| 2018 | $5,581 | $433,498 | $243,772 | $189,726 |
| 2017 | $5,392 | $424,999 | $238,993 | $186,006 |
| 2016 | $5,238 | $416,666 | $234,307 | $182,359 |
| 2015 | $5,173 | $410,408 | $230,788 | $179,620 |
| 2014 | $5,078 | $402,370 | $226,268 | $176,102 |
Source: Public Records
Map
Nearby Homes
- 4275 Marietta Ct
- 4040 Davenport Ln
- 4252 El Cerrito Rd
- 3181 Santa Maria Dr
- 414 Peppertree Rd
- 4362 Lynn Dr
- 3215 Peachwillow Ln
- 880 Madigan Ave
- 1200 Stonecrest Ln
- 3055 Treat Blvd Unit 36
- 4317 Cowell Rd
- 4497 Wildberry Ct
- 123 Kelobra Ct
- 2605 Ryan Rd
- 4324 Chelsea Way
- 4130 Storey Ln
- 2745 Minert Rd
- 810 Oak Grove Rd Unit 104
- 5244 S Montecito Dr
- 1048 Peppermill Ct
- 726 Daffodil Way
- 3535 Wild Flower Way
- 3534 Honeysuckle Way
- 716 Daffodil Way
- 3531 Wild Flower Way
- 3530 Honeysuckle Way
- 3538 Wild Flower Way
- 3534 Wild Flower Way
- 712 Daffodil Way
- 3527 Wild Flower Way
- 3526 Honeysuckle Way
- 3531 Honeysuckle Way
- 730 Daffodil Way
- 3547 Windmill Way
- 3527 Honeysuckle Way
- 3530 Wild Flower Way
- 3543 Windmill Way
- 3523 Wild Flower Way
- 3537 Windmill Way
- 3523 Honeysuckle Way
Your Personal Tour Guide
Ask me questions while you tour the home.