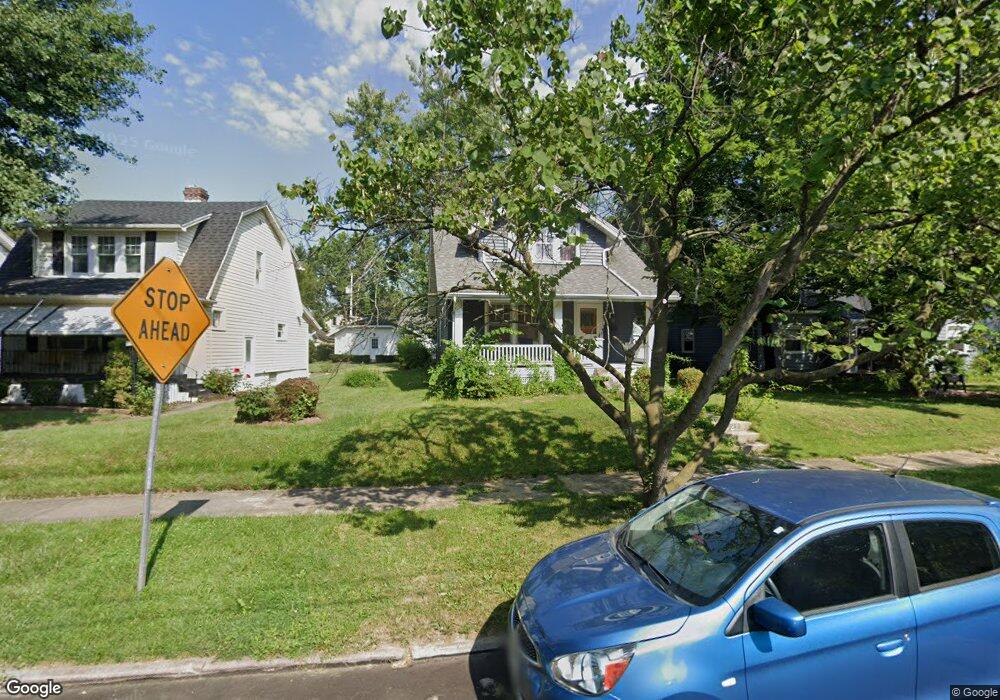
722 E Circle Dr Dayton, OH 45403
Eastern Hills NeighborhoodEstimated Value: $128,000 - $147,000
2
Beds
2
Baths
1,108
Sq Ft
$123/Sq Ft
Est. Value
About This Home
This home is located at 722 E Circle Dr, Dayton, OH 45403 and is currently estimated at $136,214, approximately $122 per square foot. 722 E Circle Dr is a home located in Montgomery County with nearby schools including Ruskin Elementary School, Kiser Elementary, and Horizon Science Academy Dayton Downtown.
Ownership History
Date
Name
Owned For
Owner Type
Purchase Details
Closed on
Mar 8, 2022
Sold by
Kelley Kevin D
Bought by
Fig 20 Llc
Current Estimated Value
Purchase Details
Closed on
Feb 15, 2022
Sold by
Kelley Kevin D
Bought by
Fig 20 Llc
Purchase Details
Closed on
Jul 21, 2006
Sold by
Devitt John J and Devitt Jean
Bought by
Kelley Kevin D
Home Financials for this Owner
Home Financials are based on the most recent Mortgage that was taken out on this home.
Original Mortgage
$76,400
Interest Rate
6.45%
Mortgage Type
Purchase Money Mortgage
Purchase Details
Closed on
Jan 22, 2003
Sold by
Leonard Marianne C
Bought by
Devitt John J
Home Financials for this Owner
Home Financials are based on the most recent Mortgage that was taken out on this home.
Original Mortgage
$74,460
Interest Rate
6.06%
Mortgage Type
VA
Purchase Details
Closed on
Nov 6, 2001
Sold by
Estate Of Thomas J Leonard
Bought by
Leonard Marianne C
Create a Home Valuation Report for This Property
The Home Valuation Report is an in-depth analysis detailing your home's value as well as a comparison with similar homes in the area
Home Values in the Area
Average Home Value in this Area
Purchase History
| Date | Buyer | Sale Price | Title Company |
|---|---|---|---|
| Fig 20 Llc | $2,343 | None Listed On Document | |
| Fig 20 Llc | $2,343 | None Listed On Document | |
| Kelley Kevin D | $89,900 | None Available | |
| Devitt John J | $73,000 | -- | |
| Leonard Marianne C | -- | -- |
Source: Public Records
Mortgage History
| Date | Status | Borrower | Loan Amount |
|---|---|---|---|
| Previous Owner | Kelley Kevin D | $76,400 | |
| Previous Owner | Devitt John J | $74,460 |
Source: Public Records
Tax History Compared to Growth
Tax History
| Year | Tax Paid | Tax Assessment Tax Assessment Total Assessment is a certain percentage of the fair market value that is determined by local assessors to be the total taxable value of land and additions on the property. | Land | Improvement |
|---|---|---|---|---|
| 2024 | $1,742 | $30,970 | $5,480 | $25,490 |
| 2023 | $1,742 | $30,970 | $5,480 | $25,490 |
| 2022 | $1,678 | $23,070 | $4,090 | $18,980 |
| 2021 | $1,669 | $23,070 | $4,090 | $18,980 |
| 2020 | $1,666 | $23,070 | $4,090 | $18,980 |
| 2019 | $1,522 | $18,930 | $4,090 | $14,840 |
| 2018 | $1,525 | $18,930 | $4,090 | $14,840 |
| 2017 | $1,513 | $18,930 | $4,090 | $14,840 |
| 2016 | $1,618 | $19,300 | $4,090 | $15,210 |
| 2015 | $1,531 | $19,300 | $4,090 | $15,210 |
| 2014 | $1,531 | $19,300 | $4,090 | $15,210 |
| 2012 | -- | $20,760 | $6,340 | $14,420 |
Source: Public Records
Map
Nearby Homes
- 631 Greenlawn Ave
- 715 Gondert Ave
- 763 Greenlawn Ave
- 1345 Jordan Ave
- 515 Heiss Ave Unit 515-517
- 1620 Gondert Ave Unit 1618
- 1620 Gondert Ave
- 1323 Huffman Ave
- 227 Livingston Ave Unit 225
- 115 Oaklawn Ave
- 1614 Huffman Ave Unit 1612
- 1629 Suman Ave
- 133 Linsan Ct
- 520 S Smithville Rd
- 40 Klee Ave
- 1714 Gondert Ave
- 1626 Darst Ave
- 1700 Suman Ave
- 404 S Smithville Rd
- 223 Pleasant Ave
- 728 E Circle Dr
- 718 E Circle Dr
- 734 E Circle Dr
- 710 E Circle Dr
- 740 E Circle Dr
- 704 E Circle Dr
- 701 Parkview Ave
- 618 W Circle Dr
- 624 W Circle Dr
- 746 E Circle Dr
- 612 W Circle Dr
- 630 W Circle Dr
- 604 W Circle Dr
- 705 Parkview Ave
- 636 W Circle Dr
- 710 Greenlawn Ave
- 714 Greenlawn Ave
- 640 W Circle Dr
- 750 E Circle Dr
- 709 Parkview Ave