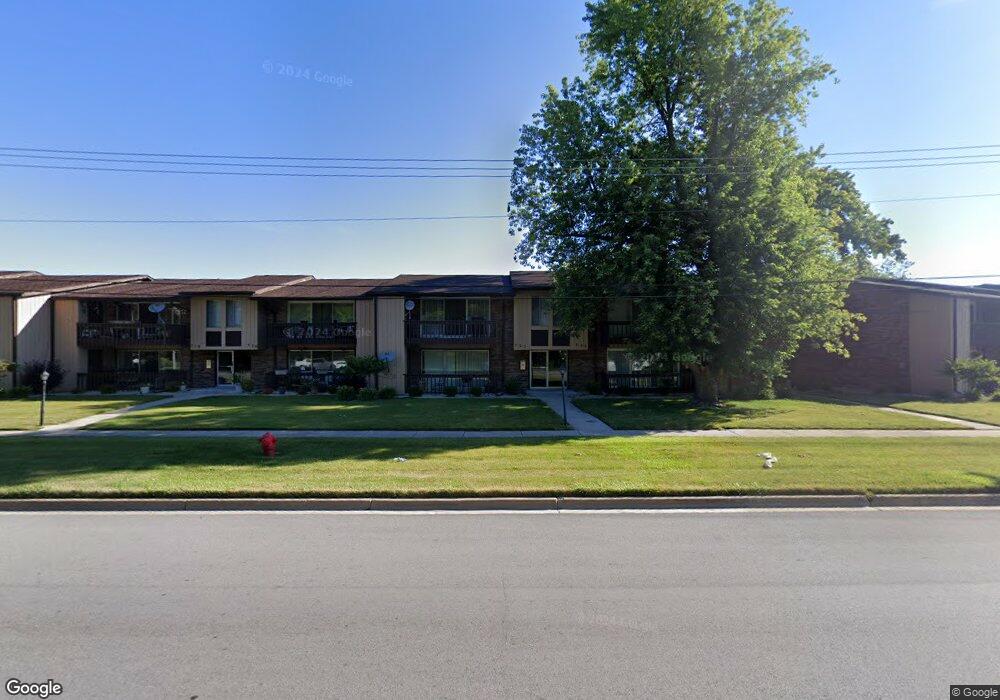
722 E Glenwood Dyer Rd Unit 722 Glenwood, IL 60425
Estimated Value: $68,000 - $92,000
2
Beds
2
Baths
1,000
Sq Ft
$84/Sq Ft
Est. Value
About This Home
This home is located at 722 E Glenwood Dyer Rd Unit 722, Glenwood, IL 60425 and is currently estimated at $83,853, approximately $83 per square foot. 722 E Glenwood Dyer Rd Unit 722 is a home located in Cook County with nearby schools including Hickory Bend Elementary School, Brookwood Middle School, and Brookwood Jr High School.
Ownership History
Date
Name
Owned For
Owner Type
Purchase Details
Closed on
Jun 10, 2022
Sold by
Thompson William E and Thompson Sara A
Bought by
Wacod Investments
Current Estimated Value
Purchase Details
Closed on
Apr 28, 2003
Sold by
Jackson Harvie and Jackson Sarah
Bought by
Thompson William E and Thompson Sara A
Home Financials for this Owner
Home Financials are based on the most recent Mortgage that was taken out on this home.
Original Mortgage
$61,750
Interest Rate
5.87%
Mortgage Type
Stand Alone First
Purchase Details
Closed on
May 23, 1996
Sold by
Nelson Paul G
Bought by
Jackson Harvis and Jackson Sarah
Home Financials for this Owner
Home Financials are based on the most recent Mortgage that was taken out on this home.
Original Mortgage
$38,500
Interest Rate
8.29%
Mortgage Type
Purchase Money Mortgage
Create a Home Valuation Report for This Property
The Home Valuation Report is an in-depth analysis detailing your home's value as well as a comparison with similar homes in the area
Home Values in the Area
Average Home Value in this Area
Purchase History
| Date | Buyer | Sale Price | Title Company |
|---|---|---|---|
| Wacod Investments | $56,500 | None Listed On Document | |
| Thompson William E | $65,000 | Cti | |
| Thompson William E | $65,000 | Cti | |
| Jackson Harvis | $56,000 | -- |
Source: Public Records
Mortgage History
| Date | Status | Borrower | Loan Amount |
|---|---|---|---|
| Previous Owner | Thompson William E | $61,750 | |
| Previous Owner | Jackson Harvis | $38,500 |
Source: Public Records
Tax History Compared to Growth
Tax History
| Year | Tax Paid | Tax Assessment Tax Assessment Total Assessment is a certain percentage of the fair market value that is determined by local assessors to be the total taxable value of land and additions on the property. | Land | Improvement |
|---|---|---|---|---|
| 2024 | $2,257 | $5,543 | $1,181 | $4,362 |
| 2023 | $18 | $5,542 | $1,180 | $4,362 |
| 2022 | $18 | $3,455 | $1,111 | $2,344 |
| 2021 | $66 | $3,454 | $1,111 | $2,343 |
| 2020 | $187 | $3,454 | $1,111 | $2,343 |
| 2019 | $0 | $2,982 | $1,041 | $1,941 |
| 2018 | $1,052 | $5,470 | $1,041 | $4,429 |
| 2017 | $1,092 | $5,470 | $1,041 | $4,429 |
| 2016 | $1,401 | $5,145 | $972 | $4,173 |
| 2015 | $1,294 | $5,145 | $972 | $4,173 |
| 2014 | $1,299 | $5,145 | $972 | $4,173 |
| 2013 | $1,514 | $5,950 | $972 | $4,978 |
Source: Public Records
Map
Nearby Homes
- 710 E 194th St
- 252 S Ellis Ave
- 307 S Walnut St
- 951 E 193rd St
- 308 S Walnut St
- 830 E 191st Place Unit 709
- 232 S Walnut St
- 339 S Dorchester Ave
- 308 S Dorchester Ave
- 225 S Willow St
- 306 S Blackstone Ave
- 19119 S Saint Lawrence Ave
- 424 E Clark St
- 242 S Harper Ave
- 120 S Chestnut Ln
- 304 E Birch Dr
- 350 E Tulip Dr
- 40 N Sycamore Ln
- 108 Campbell Ave
- 417 Glenwoodie Dr
- 722 E Glenwood Dyer Rd Unit 722
- 720 E Glenwood Dyer Rd Unit G2
- 720 E Glenwood Dyer Rd Unit 720
- 720 E Glenwood Dyer Rd Unit 720
- 720 E Glenwood Dyer Rd Unit 2B
- 716 E Glenwood Dyer Rd Unit 716
- 716 E Glenwood Dyer Rd Unit G3
- 716 E Glenwood Dyer Rd Unit 716
- 716 E Glenwood Dyer Rd Unit A
- 736 E Glenwood Dyer Rd Unit 1
- 736 E Glenwood Dyer Rd Unit 736
- 736 E Glenwood Dyer Rd Unit 736
- 736 E Glenwood Dyer Rd Unit G9
- 736 E Glenwood Dyer Rd Unit B
- 736 E Glenwood Dyer Rd Unit A
- 736 E Glenwood Dyer Rd Unit 2A
- 730 E Glenwood Dyer Rd Unit 730
- 730 E Glenwood Dyer Rd Unit 730
- 724 E Glenwood Dyer Rd Unit 724
- 724 E Glenwood Dyer Rd Unit 724