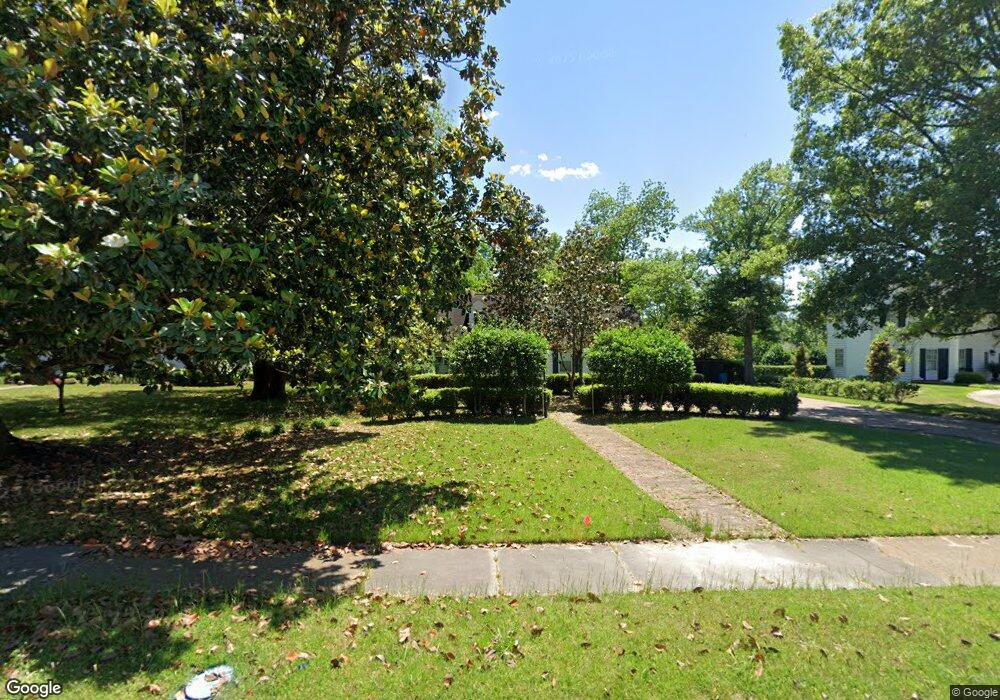
722 E Main St West Point, MS 39773
Estimated Value: $314,000 - $358,000
4
Beds
3
Baths
2,199
Sq Ft
$155/Sq Ft
Est. Value
About This Home
This home is located at 722 E Main St, West Point, MS 39773 and is currently estimated at $340,578, approximately $154 per square foot. 722 E Main St is a home located in Clay County with nearby schools including East Side Elementary School, West Clay Elementary School, and Church Hill Elementary School.
Ownership History
Date
Name
Owned For
Owner Type
Purchase Details
Closed on
Sep 22, 2025
Sold by
Rice Lydia Ruth
Bought by
Rice Lydia Ruth and Rice Christopher Deon
Current Estimated Value
Home Financials for this Owner
Home Financials are based on the most recent Mortgage that was taken out on this home.
Original Mortgage
$75,060
Outstanding Balance
$74,858
Interest Rate
6.58%
Mortgage Type
New Conventional
Estimated Equity
$265,720
Purchase Details
Closed on
May 21, 2020
Sold by
Ferrell Christian Leigh and Ferrell Timothy
Bought by
Rice Lydia Ruth
Home Financials for this Owner
Home Financials are based on the most recent Mortgage that was taken out on this home.
Original Mortgage
$204,232
Interest Rate
3.3%
Mortgage Type
New Conventional
Purchase Details
Closed on
Apr 3, 2020
Sold by
Mcbrayer Chris R and Mcbrayer Romona W
Bought by
Farrell Christian
Home Financials for this Owner
Home Financials are based on the most recent Mortgage that was taken out on this home.
Original Mortgage
$204,232
Interest Rate
3.3%
Mortgage Type
New Conventional
Create a Home Valuation Report for This Property
The Home Valuation Report is an in-depth analysis detailing your home's value as well as a comparison with similar homes in the area
Purchase History
| Date | Buyer | Sale Price | Title Company |
|---|---|---|---|
| Rice Lydia Ruth | -- | Vantage Point Title Inc | |
| Rice Lydia Ruth | -- | -- | |
| Farrell Christian | -- | -- |
Source: Public Records
Mortgage History
| Date | Status | Borrower | Loan Amount |
|---|---|---|---|
| Open | Rice Lydia Ruth | $75,060 | |
| Previous Owner | Rice Lydia Ruth | $204,232 |
Source: Public Records
Tax History
| Year | Tax Paid | Tax Assessment Tax Assessment Total Assessment is a certain percentage of the fair market value that is determined by local assessors to be the total taxable value of land and additions on the property. | Land | Improvement |
|---|---|---|---|---|
| 2025 | $1,666 | $30,716 | $2,472 | $28,244 |
| 2024 | $1,666 | $30,716 | $2,472 | $28,244 |
| 2023 | $3,818 | $25,508 | $2,472 | $23,036 |
| 2022 | $1,391 | $25,508 | $2,472 | $23,036 |
| 2021 | $965 | $25,508 | $2,472 | $23,036 |
| 2020 | $969 | $20,584 | $2,472 | $18,112 |
| 2019 | $964 | $21,702 | $2,472 | $19,230 |
| 2018 | $926 | $21,702 | $2,472 | $19,230 |
| 2017 | $926 | $21,702 | $2,472 | $19,230 |
| 2016 | $902 | $21,702 | $2,472 | $19,230 |
| 2015 | $828 | $19,748 | $2,472 | $17,276 |
| 2014 | $636 | $19,748 | $2,472 | $17,276 |
| 2013 | $636 | $25,691 | $3,708 | $21,983 |
Source: Public Records
Map
Nearby Homes
- 26788 E Main St
- 26852 E Main St
- 26596 E Main St
- 27045 E Main St
- 551 E Westbrook St
- 123 Cottrell St
- 184 Tournament St
- 238 Calhoun St
- 530 E Morrow St
- 33 Court
- 341 Mccord St
- 228 S Division St
- 761 E Morrow St
- 229 S Division St
- 913 E Westbrook St
- 228 Mccord St
- 13 Cul de Sac St
- 507 S Eshman Ave
- 159 Washington St
- 1046 E Brame Ave
Your Personal Tour Guide
Ask me questions while you tour the home.